

Question: Table 56.1 Factors for Computing Control Chart Limits (3) Upper Control limit =1.639, Lower Control Limit =0 Upper Control limit =1.143, Lower Control Limit =0.307
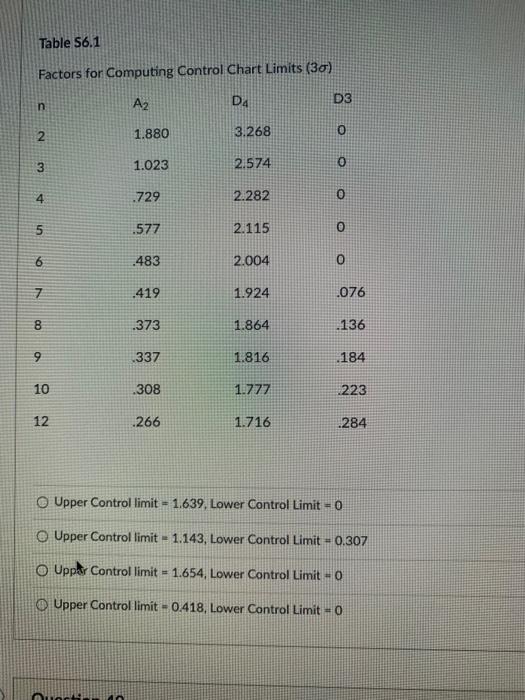
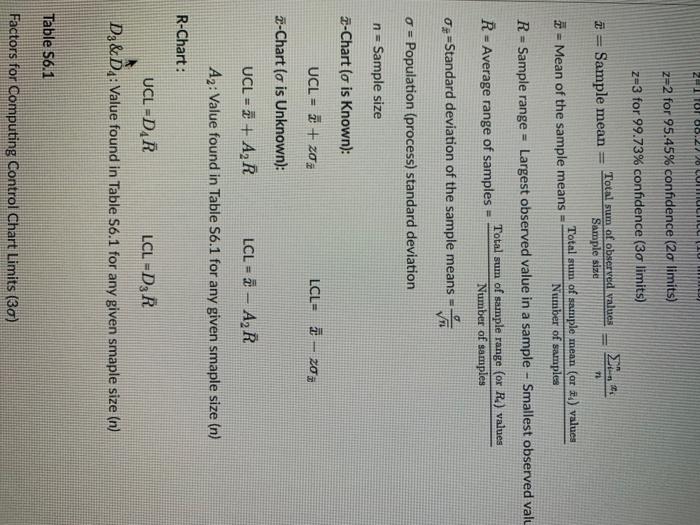
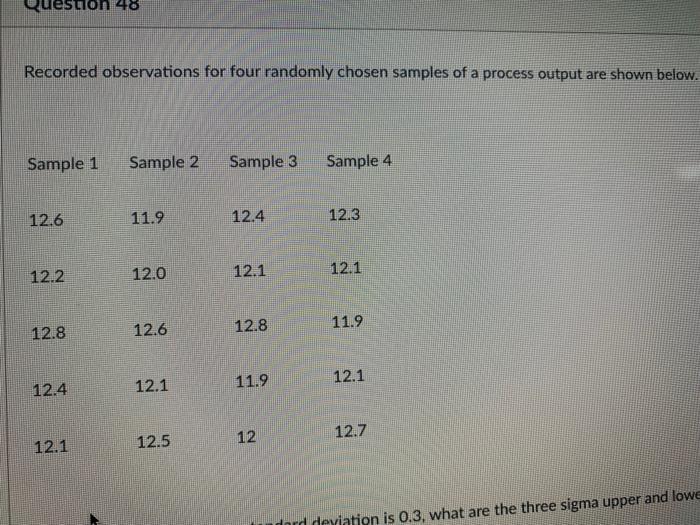
Table 56.1 Factors for Computing Control Chart Limits (3) Upper Control limit =1.639, Lower Control Limit =0 Upper Control limit =1.143, Lower Control Limit =0.307 Uppar Control limit =1.654, Lower Control Limit =0 Upper Control limit =0.418, Lower Control Limit =0 z=2 for 95.45% confidence ( 2 limits) z=3 for 99.73% confidence ( 3 limits) x=Samplemean=SamplesizeTotalsumofobservedvalues=ninnxix=Meanofthesamplemeans=NumberofsamplesTotalsumofsamplemean(orx1)values R= Sample range = Largest observed value in a sample - Smallest observed va R= Average range of samples =NumberofsamplesTotalsumofsamplerange(orR2)values x= Standard deviation of the sample means =n = Population (process) standard deviation n= Sample size x-Chart ( is Known): UCL=x+zxLCL=xzx x-Chart ( is Unknown): UCL=x+A2RLCL=xA2R A2 : Value found in Table S6.1 for any given smaple size (n) R-Chart: UCL=D4RLCL=D3R D3&D4: Value found in Table S6.1 for any given smaple size (n) Table 56.1 Factors for Computing Control Chart Limits (3) Recorded observations for four randomly chosen samples of a process output are shown below
Step by Step Solution
There are 3 Steps involved in it

Get step-by-step solutions from verified subject matter experts