

Question: TABLE 6 E . 1 9 New Data for Exercise 6 . 4 3 6 . 4 3 . Continuation of Exercise 6 . 4
TABLE E
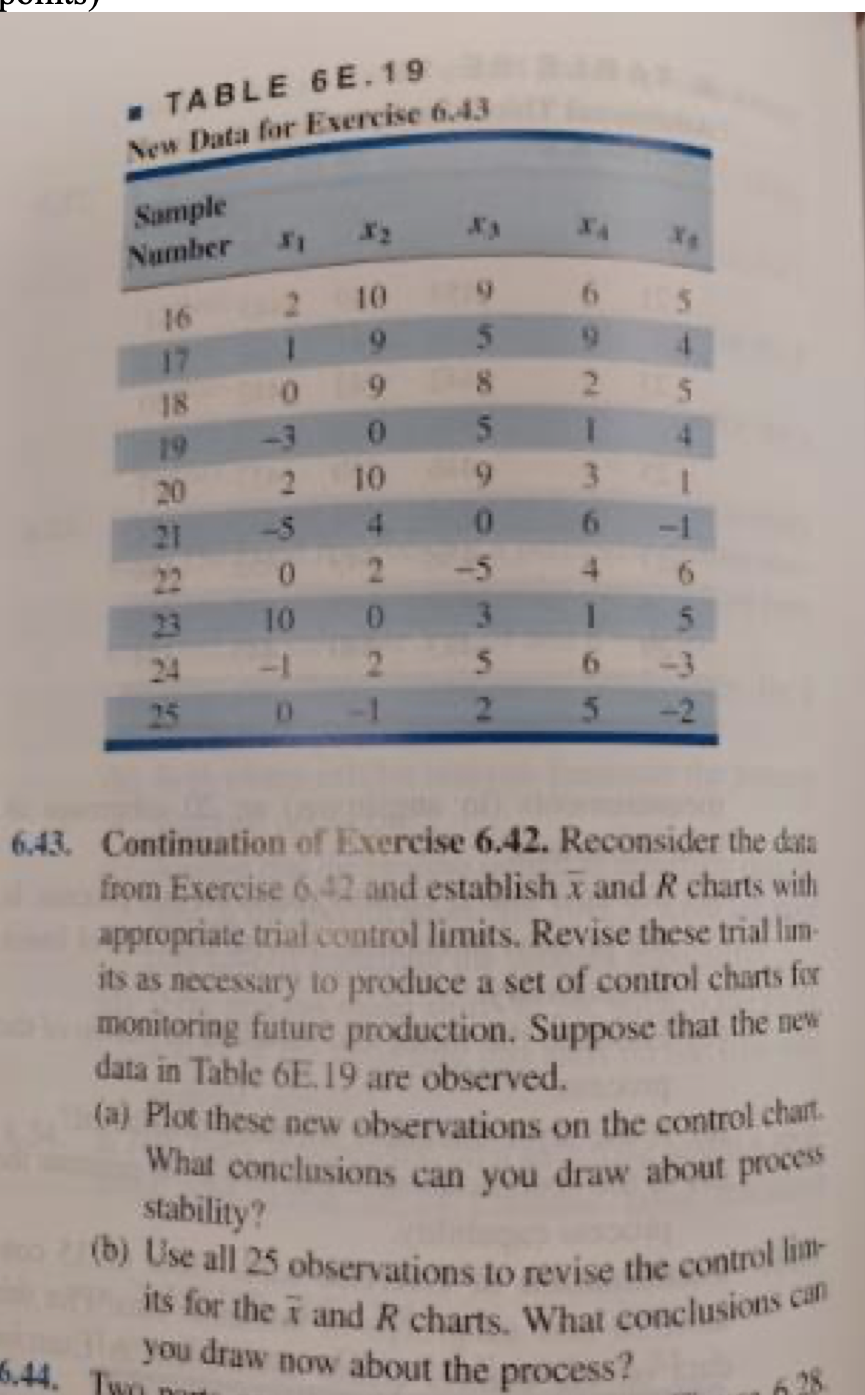
New Data for Exercise
Continuation of Exercise Reconsider the data
from Exercise and establish and charts with
appropriate trial control limits Revise these trial lun
its as necessary to produce a set of control charts for
monitoring future production. Suppose that the net
data in Table are observed.
a Plot these new observations on the control chant.
What conclusions can you draw about proces
stability?
b Use all observations to revise the control liat
its for the and charts. What conclusions can
you draw now about the process?
Step by Step Solution
There are 3 Steps involved in it
1 Expert Approved Answer
Step: 1 Unlock

Question Has Been Solved by an Expert!
Get step-by-step solutions from verified subject matter experts
Step: 2 Unlock
Step: 3 Unlock