

Question: table attached below Refer to Table 5.1. What possible explanations could there be for homeless utilizing services less than might be expected? Could it be
table attached below 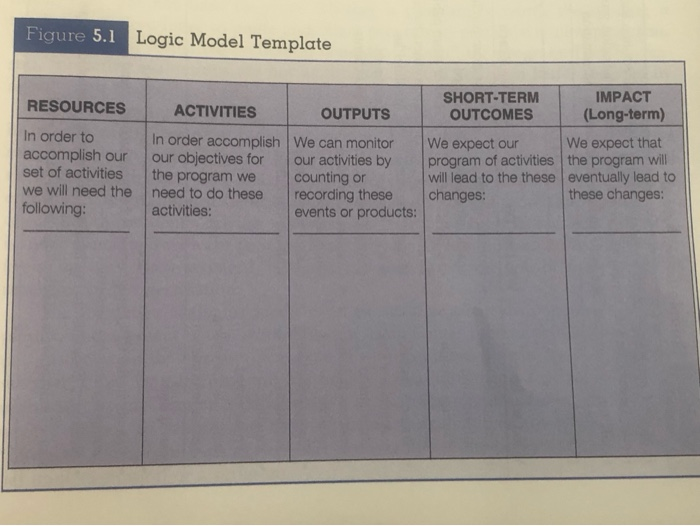
Refer to Table 5.1. What possible explanations could there be for homeless utilizing services less than might be expected? Could it be argued that some populations have a greater need for services than their proportion in a communitys total population?
Figure 5.1 Logic Model Template RESOURCES In order to accomplish our set of activities we will need the following: SHORT-TERM IMPACT ACTIVITIES OUTPUTS OUTCOMES (Long-term) In order accomplish We can monitor We expect our We expect that our objectives for our activities by program of activities the program will the program we counting or will lead to the these eventually lead to need to do these recording these changes: these changes: activities: events or productsStep by Step Solution
There are 3 Steps involved in it
1 Expert Approved Answer
Step: 1 Unlock

Question Has Been Solved by an Expert!
Get step-by-step solutions from verified subject matter experts
Step: 2 Unlock
Step: 3 Unlock