

Question: TABLE B The Binomial Distribution P n X 0.05 0.1 0.2 0.25 0.3 0.4 0.5 0.6 0.7 0.75 0.8 0.9 0.95 0 0.902 0.810 0.640

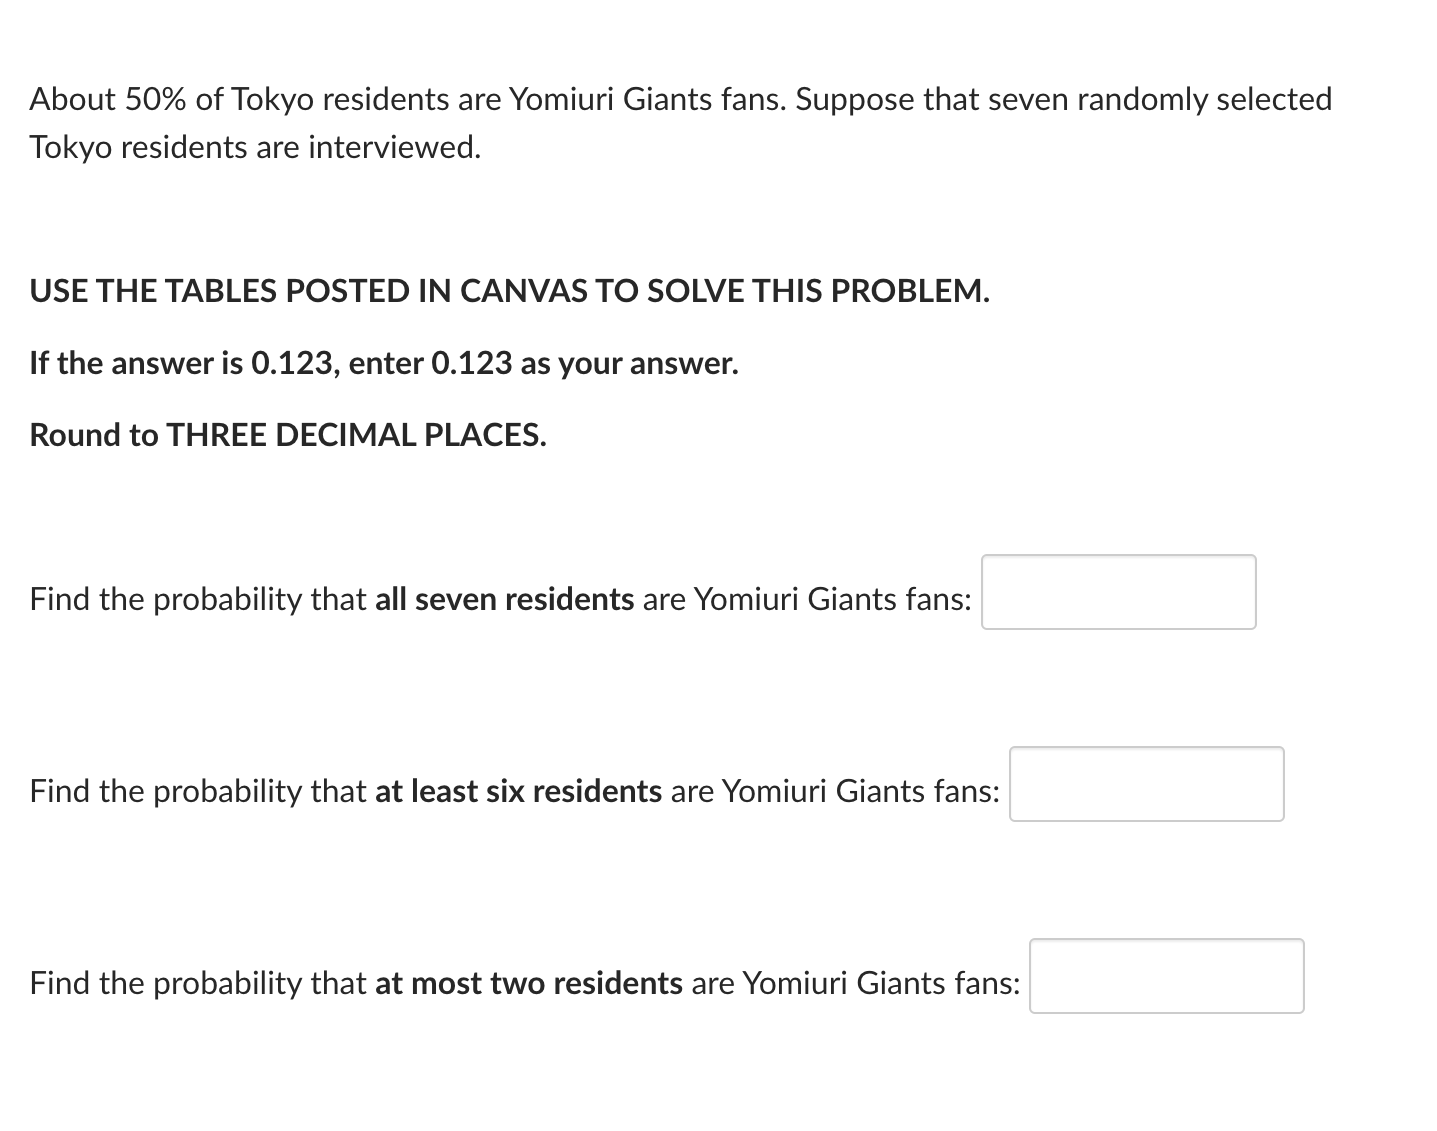
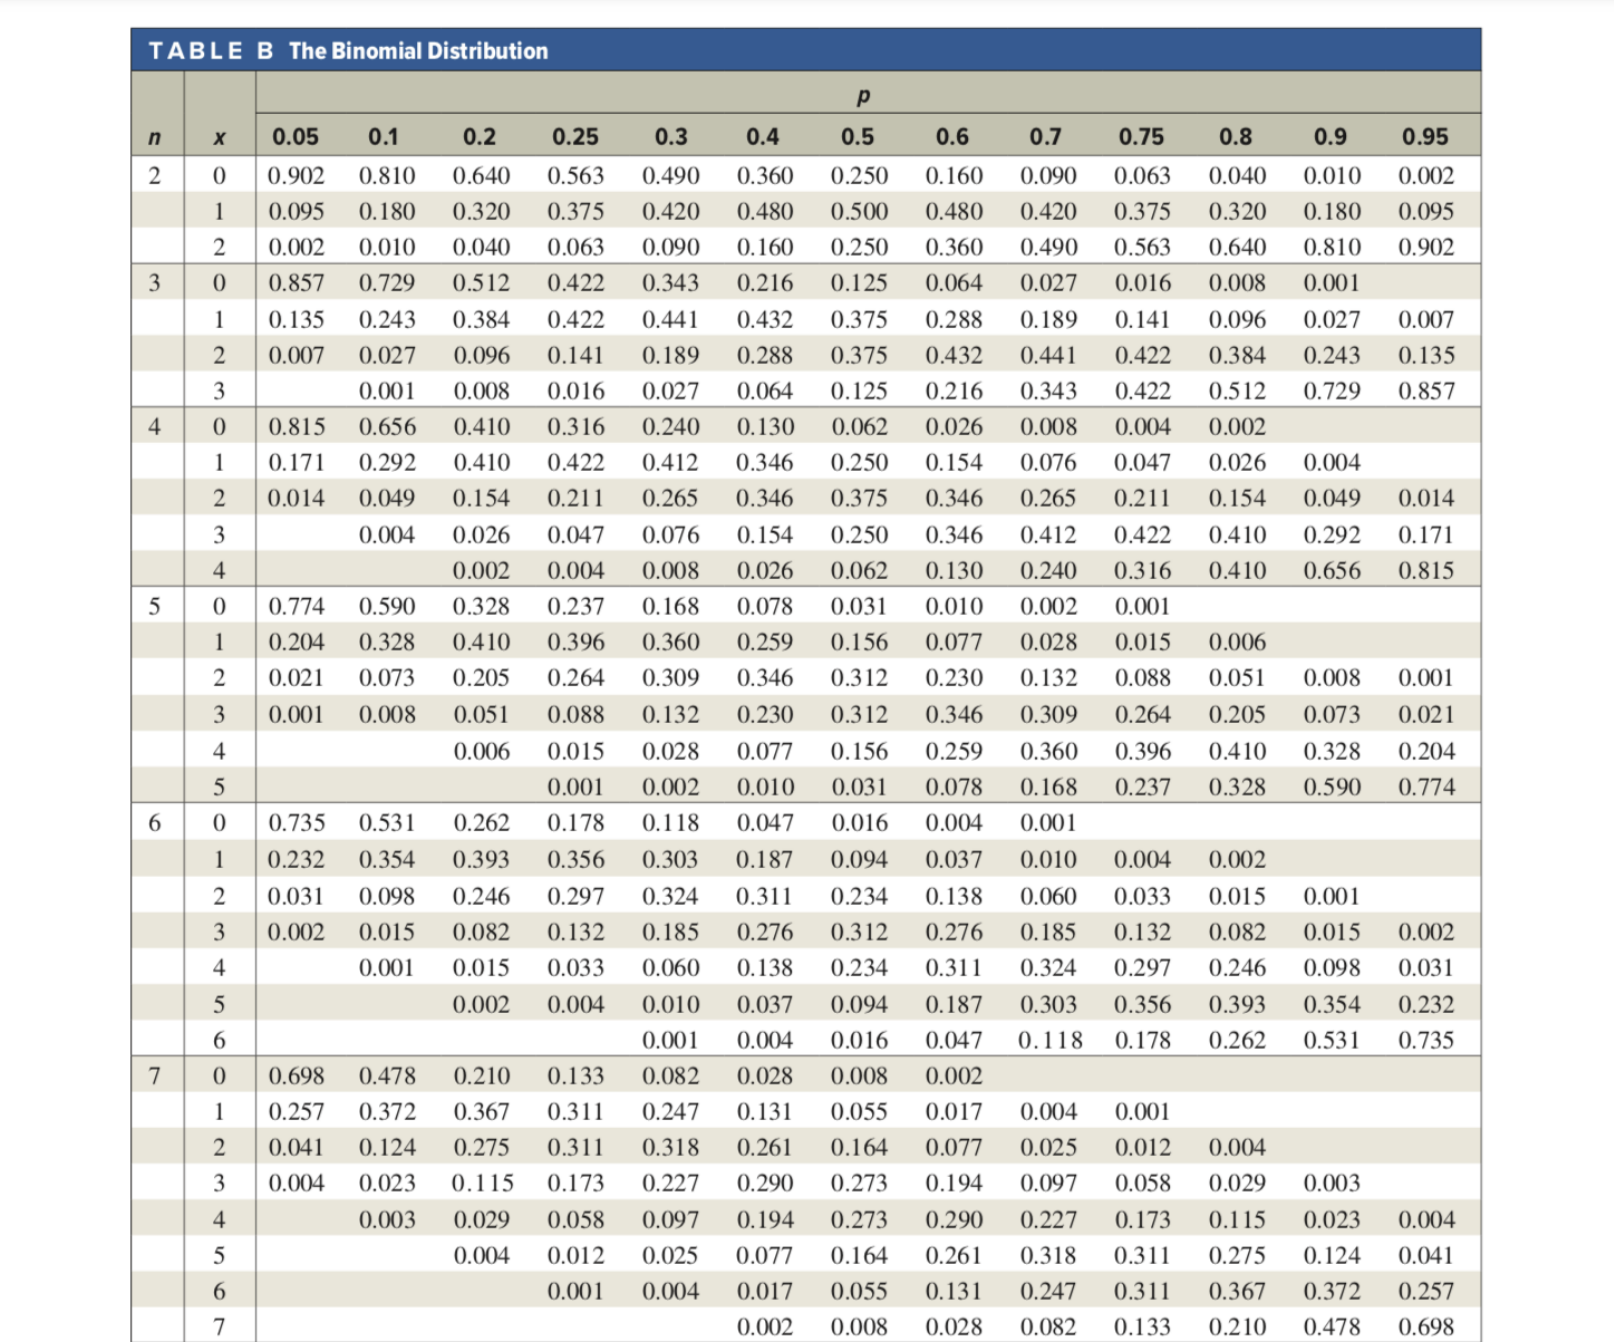

TABLE B The Binomial Distribution P n X 0.05 0.1 0.2 0.25 0.3 0.4 0.5 0.6 0.7 0.75 0.8 0.9 0.95 0 0.902 0.810 0.640 0.563 0.490 0.360 0.250 0.160 0.090 0.063 0.040 0.010 0.002 0.095 0.180 0.320 0.375 0.420 0.480 0.500 0.480 0.420 0.375 0.320 0.180 0.095 N 0.002 0.010 0.040 0.063 0.090 0.160 0.250 0.360 0.490 0.563 0.640 0.810 0.902 3 0.857 0.729 0.512 0.422 0.343 0.216 0.125 0.064 0.027 0.016 0.008 0.001 0.135 0.243 0.384 0.422 0.441 0.432 0.375 0.288 0.189 0.141 0.096 0.027 0.007 IN 0.007 0.027 0.096 0.141 0.189 0.288 0.375 0.432 0.441 0.422 0.384 0.243 0.135 0.001 0.008 0.016 0.027 0.064 0.125 0.216 0.343 0.422 0.512 0.729 0.857 4 0 0.815 0.656 0.410 0.316 0.240 0.130 0.062 0.026 0.008 0.004 0.002 0.171 0.292 0.410 0.422 0.412 0.346 0.250 0.154 0.076 0.047 0.026 0.004 0.014 0.049 0.154 0.21 1 0.265 0.346 0.375 0.346 0.265 0.211 0.154 0.049 0.014 A W N 0.004 0.026 0.047 0.076 0.154 0.250 0.346 0.412 0.422 0.410 0.292 0.171 0.002 0.004 0.008 0.026 0.062 0.130 0.240 0.316 0.410 0.656 0.815 0 0.774 0.590 0.328 0.237 0.168 0.078 0.031 0.010 0.002 0.001 0.204 0.328 0.410 0.396 0.360 0.259 0.156 0.077 0.028 0.015 0.006 N 0.021 0.073 0.205 0.264 0.309 0.346 0.312 0.230 0.132 0.088 0.051 0.008 0.001 0.001 0.008 0.051 0.088 0.132 0.230 0.312 0.346 0.309 0.264 0.205 0.073 0.021 UI A W 0.006 0.015 0.028 0.077 0.156 0.259 0.360 0.396 0.410 0.328 0.204 0.001 0.002 0.010 0.031 0.078 0.168 0.237 0.328 0.590 0.774 0 0.735 0.531 0.262 0.178 0.118 0.047 0.016 0.004 0.001 0.232 0.354 0.393 0.356 0.303 0.187 0.094 0.037 0.010 0.004 0.002 0.031 0.098 0.246 0.297 0.324 0.311 0.234 0.138 0.060 0.033 0.015 0.001 W N 0.002 0.015 0.082 0.132 0.185 0.276 0.312 0.276 0.185 0.132 0.082 0.015 0.002 4 0.001 0.015 0.033 0.060 0.138 0.234 0.311 0.324 0.297 0.246 0.098 0.031 0.002 0.004 0.010 0.037 0.094 0.187 0.303 0.356 0.393 0.354 0.232 6 0.001 0.004 0.016 0.047 0.118 0.178 0.262 0.531 0.735 0 0.698 0.478 0.210 0.133 0.082 0.028 0.008 0.002 0.257 0.372 0.367 0.311 0.247 0.131 0.055 0.017 0.004 0.001 0.041 0.124 0.275 0.311 0.318 0.261 0.164 0.077 0.025 0.012 0.004 0.004 0.023 0.115 0.173 0.227 0.290 0.273 0.194 0.097 0.058 0.029 0.003 0.003 0.029 0.058 0.097 0.194 0.273 0.290 0.227 0.173 0.115 0.023 0.004 J au AWN 0.004 0.012 0.025 0.077 0.164 0.261 0.318 0.311 0.275 0.124 0.041 0.001 0.004 0.017 0.055 0.131 0.247 0.311 0.367 0.372 0.257 0.002 0.008 0.028 0.082 0.133 0.210 0.478 0.698About 50% of Tokyo residents are Yomiuri Giants fans. Suppose that seven randomly selected Tokyo residents are interviewed. USE THE TABLES POSTED IN CANVAS TO SOLVE THIS PROBLEM. If the answer is 0.123, enter 0.123 as your answer. Round to THREE DECIMAL PLACES. Find the probability that all seven residents are Yomiuri Giants fans: Find the probability that at least six residents are Yomiuri Giants fans: Find the probability that at most two residents are Yomiuri Giants fans
Step by Step Solution
There are 3 Steps involved in it

Get step-by-step solutions from verified subject matter experts