

Question: table is attached in screen Next Question Use the given data set to complete parts (a) through (b) below. (Use a = 0.05.) X 10
table is attached in screen
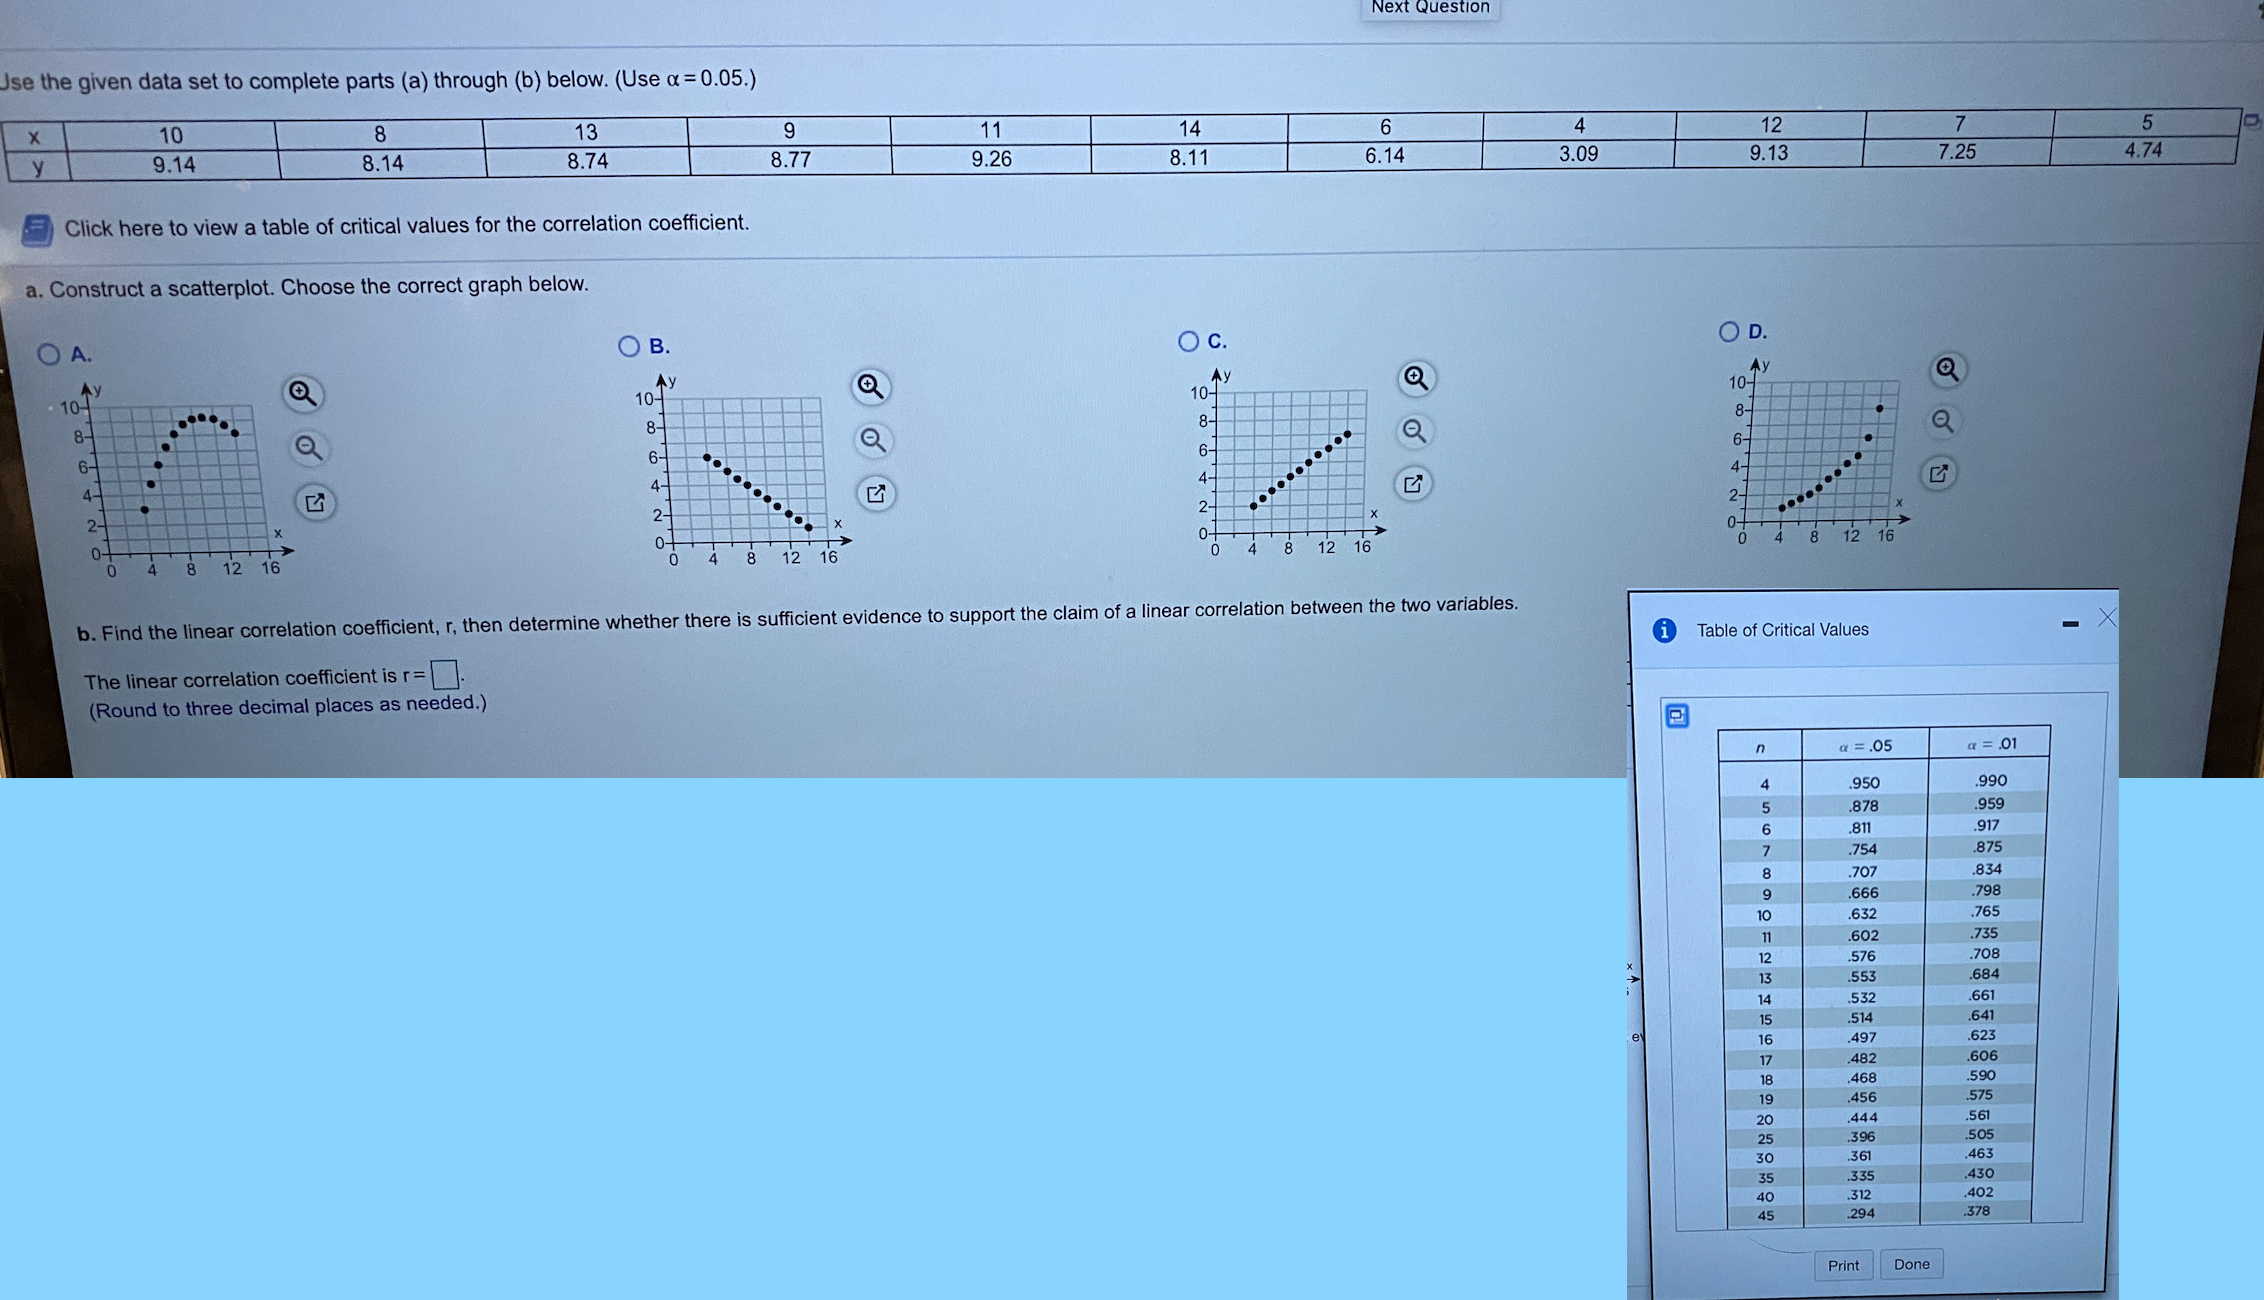
Next Question Use the given data set to complete parts (a) through (b) below. (Use a = 0.05.) X 10 8 13 9 11 14 6 4 3.14 12 8.14 .74 7 5 8.77 9.26 3.1 6.14 3.09 9.13 7.25 1.74 Click here to view a table of critical values for the correlation coefficient. a. Construct a scatterplot. Choose the correct graph below. O A. O B. O c. OD. 10-T Ay 10- 10-7 8- 8- 8- 6- 6- 4- 2- 2- . . .... of 12 12 16 8 12 16 4 8 12 16 b. Find the linear correlation coefficient, r, then determine whether there is sufficient evidence to support the claim of a linear correlation between the two variables. i Table of Critical Values X The linear correlation coefficient is r =. (Round to three decimal places as needed.) n a = .05 a = .01 950 990 .878 .959 811 .917 .754 .875 .707 834 666 798 632 765 602 735 -v x 576 708 553 684 532 661 514 641 497 623 482 606 468 590 456 575 444 561 396 505 361 463 .335 430 312 402 294 378 Print Done
Step by Step Solution
There are 3 Steps involved in it

Get step-by-step solutions from verified subject matter experts