

Question: Table Represent from A through D 115-193 The data in the table represent the tuition for all 2-year community colleges in a region in 2014-2015
Table Represent from A through D
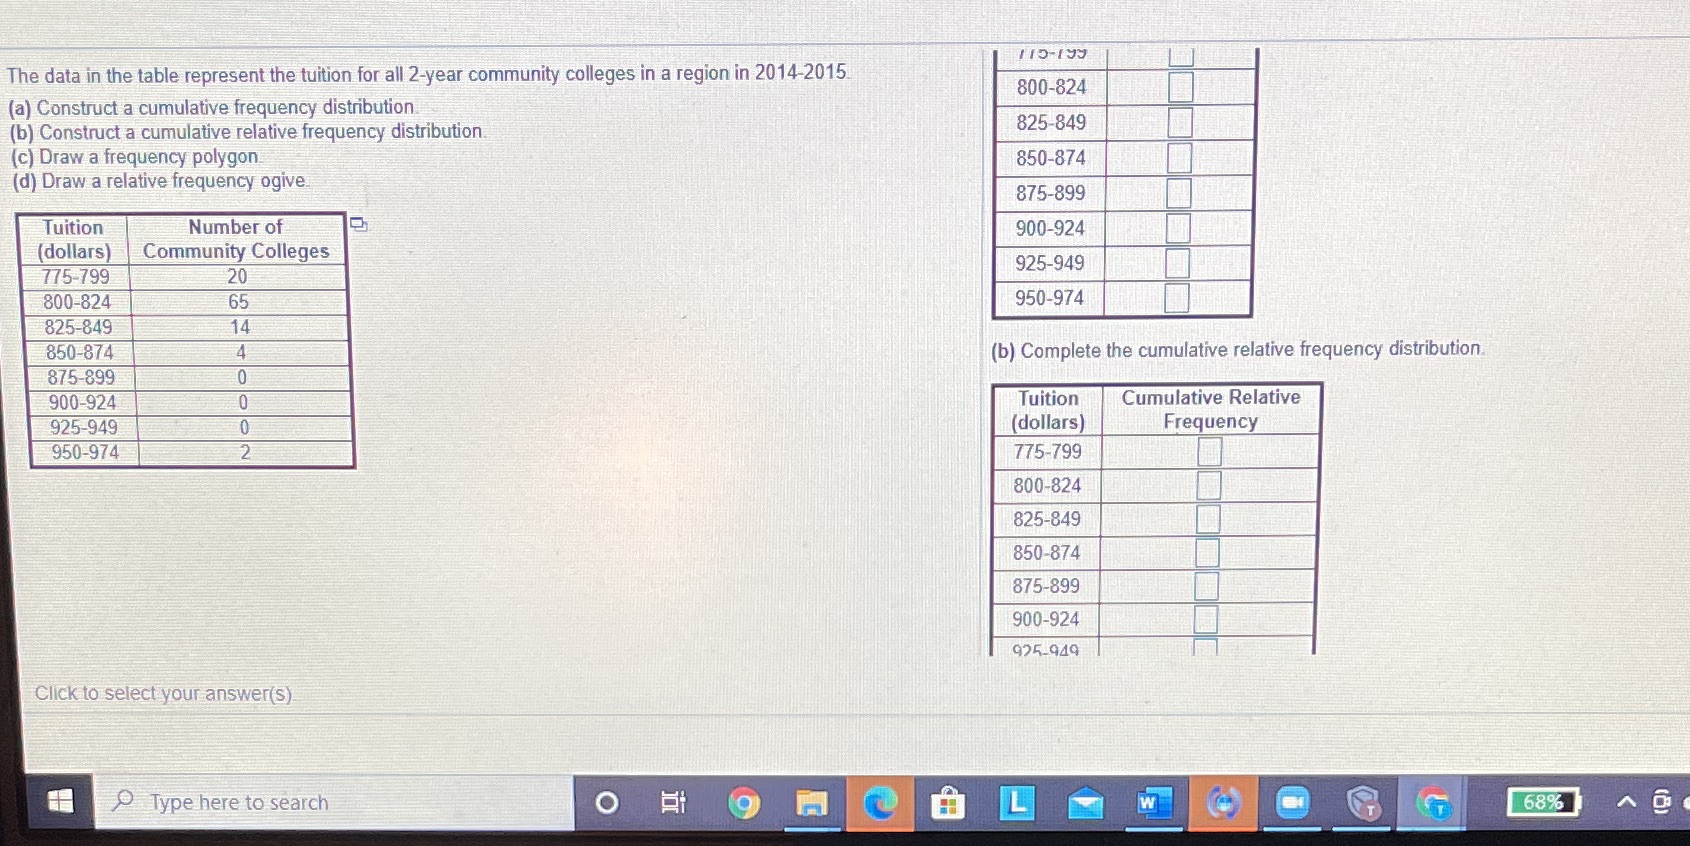
115-193 The data in the table represent the tuition for all 2-year community colleges in a region in 2014-2015 800-824 (a) Construct a cumulative frequency distribution. (b) Construct a cumulative relative frequency distribution 825-849 (c) Draw a frequency polygon 850-874 (d) Draw a relative frequency ogive 875-899 Tuition Number of 900-924 (dollars) Community Colleges 925-949 775-799 20 800-824 65 950-974 825-849 14 850-874 4 (b) Complete the cumulative relative frequency distribution. 875-899 0 900-924 0 Tuition Cumulative Relative 925-949 (dollars) Frequency NO 950-974 775-799 800-824 825-849 850-874 875-899 900-924 925-949 Click to select your answer(s) Type here to search O Fi 9 L W 68%
Step by Step Solution
There are 3 Steps involved in it

Get step-by-step solutions from verified subject matter experts