

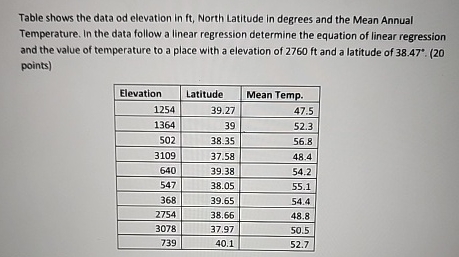
Question: Table shows the data od elevation in f t , North Latitude in degrees and the Mean Annual Temperature. In the data follow a linear
Table shows the data od elevation in North Latitude in degrees and the Mean Annual Temperature. In the data follow a linear regression determine the equation of linear regression and the value of temperature to a place with a elevation of and a latitude of points
tableElevationLatitude,Mean Temp.
Step by Step Solution
There are 3 Steps involved in it
1 Expert Approved Answer
Step: 1 Unlock

Question Has Been Solved by an Expert!
Get step-by-step solutions from verified subject matter experts
Step: 2 Unlock
Step: 3 Unlock