

Question: Table: Survey ResultsConstruct a Histogram. Make five to six intervals,. Frequency / Number of pairs of shoesCalculate following values: 1. x2. -3. -4. x-=5. s=Are
Table: Survey ResultsConstruct a Histogram. Make five to six intervals,. Frequency / Number of pairs of shoesCalculate following values: 1. x2. -3. -4. x-=5. s=Are the data discrete or continuous? How do you know?In complete sentences describe the shape of the histogram.Are there any potential outliers? List the values that could be outliers. Use a formula to check the end values to determine if they are potential outliers.1. Determine the following values.1. Min=2. M=3. Max=4. Q1=5. Q3=6.IQR=2. Construct a box plot of data 3. What shape of the box plot imply about the concentration of data? Use complete sentences. 4. Using the box plot, how can you determine if there are potential outliers?5. How does standard deviation help you determine concentration of the data and wether or not there are potential outliers? 6. What does IQR represent in this problem?7. Show your work to find the value that is 1.5 standard deviations:Above the mean Blow the mean
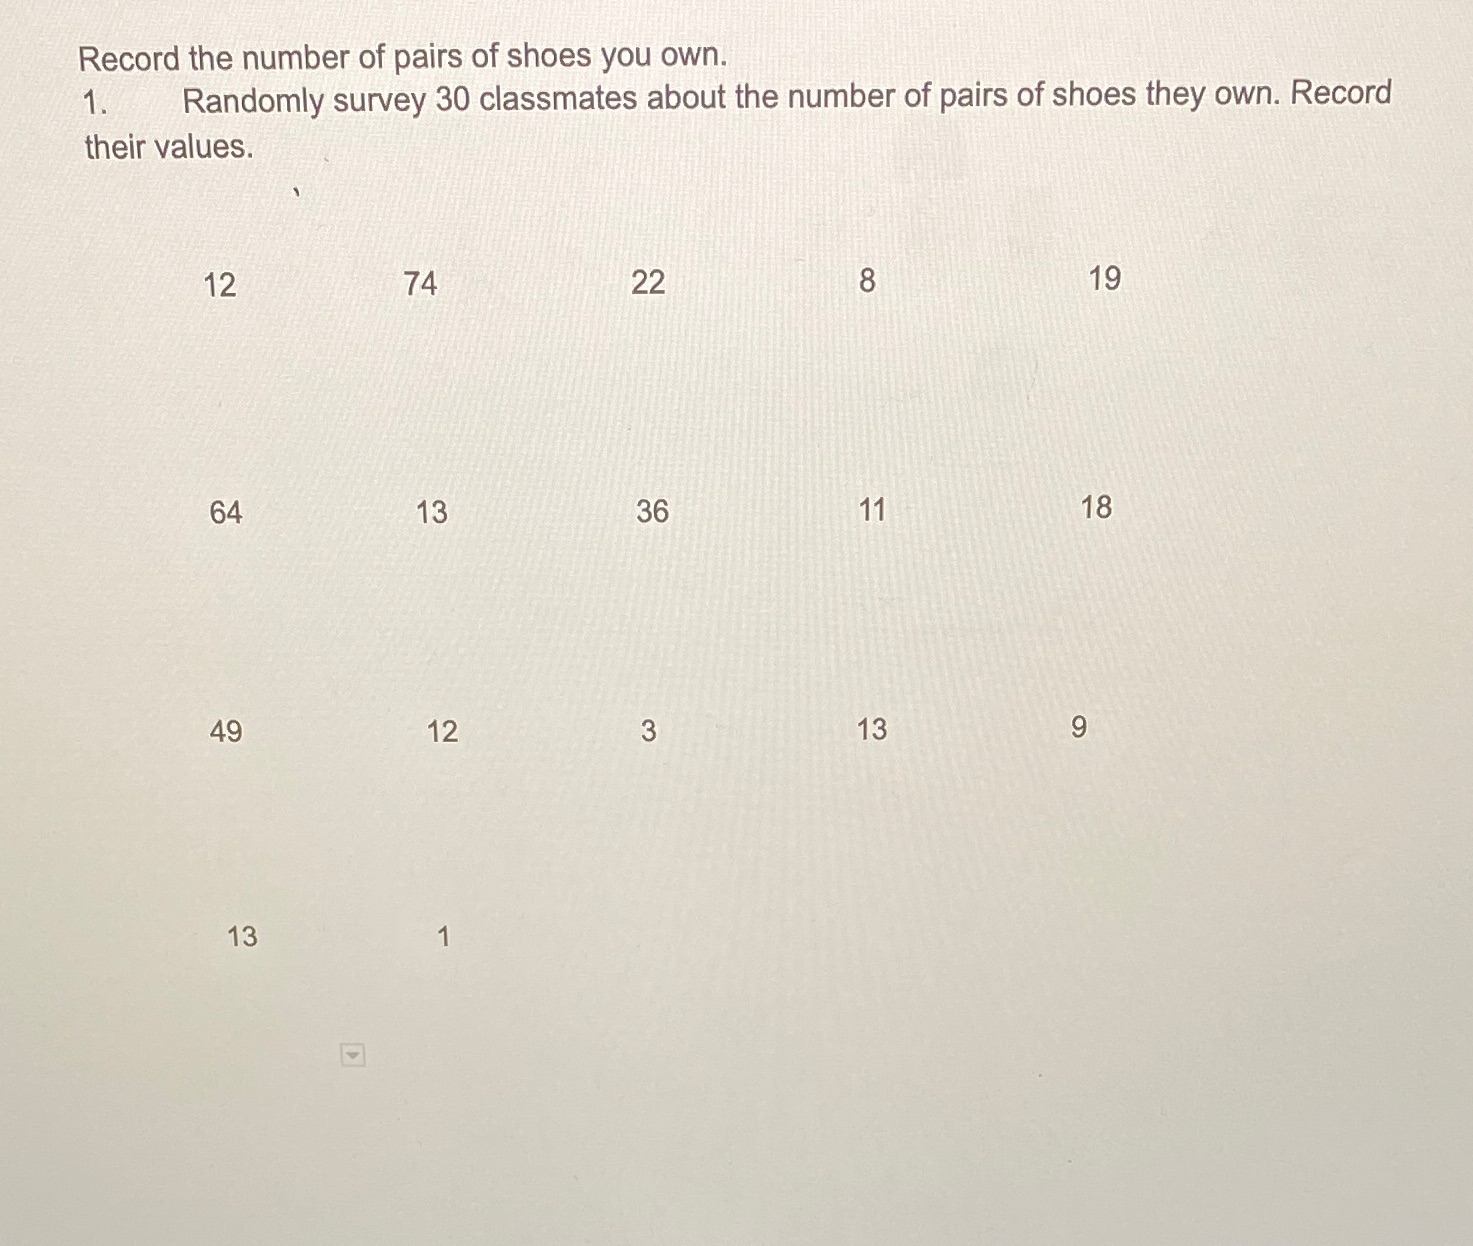
Record the number of pairs of shoes you own. 1. Randomly survey 30 classmates about the number of pairs of shoes they own. Record their values. 12 74 22 19 64 13 36 11 18 49 12 3 13 9 13 1
Step by Step Solution
There are 3 Steps involved in it

Get step-by-step solutions from verified subject matter experts