

Question: TABLE:1 1 2. 3 4 11 12 13 14 15 16 17 18 19 21 22 23 24 25 26 27 28 5 31 32
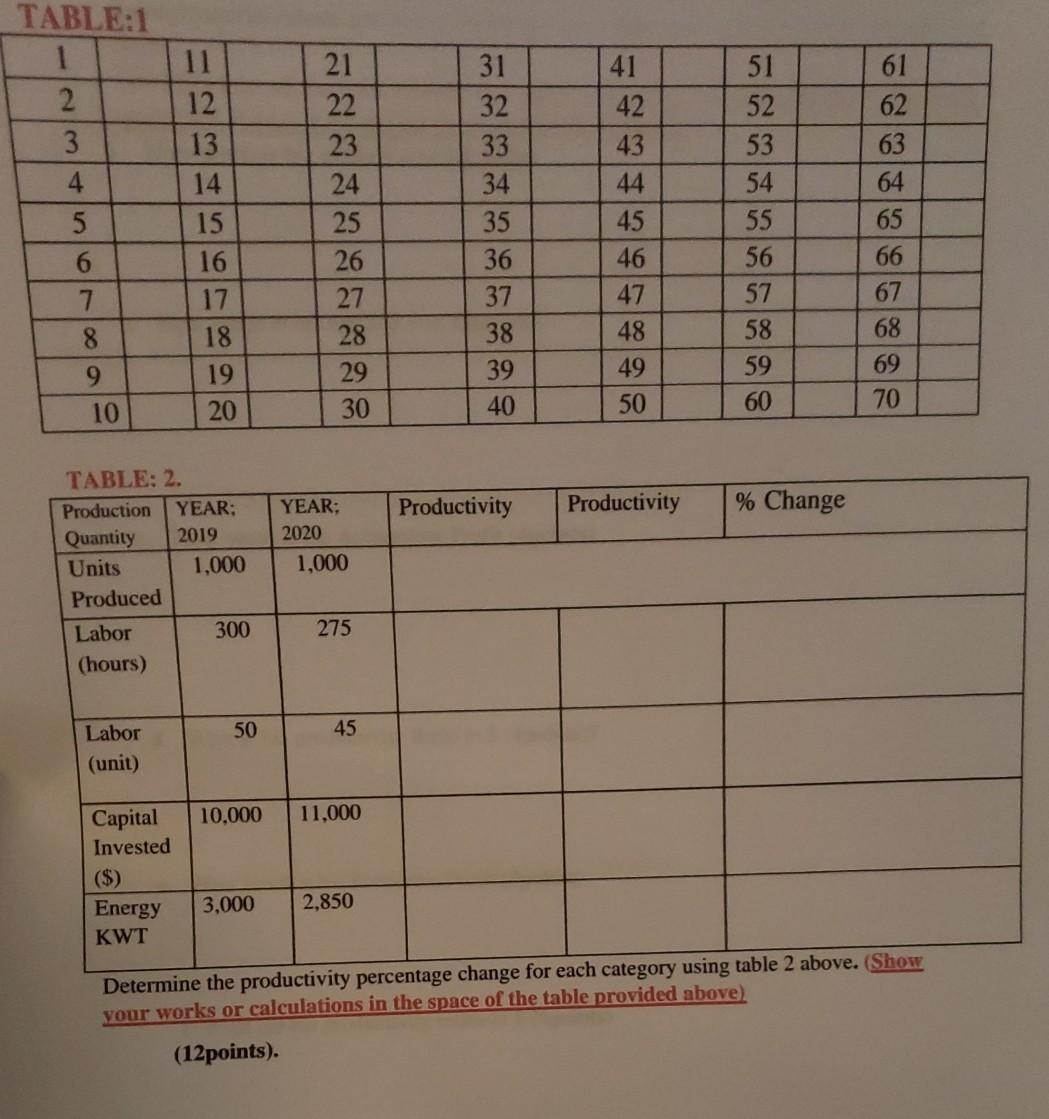
TABLE:1 1 2. 3 4 11 12 13 14 15 16 17 18 19 21 22 23 24 25 26 27 28 5 31 32 33 34 35 36 37 38 39 40 41 42 43 44 45 46 47 48 49 50 51 52 53 54 55 56 57 58 59 60 61 62 63 64 65 66 67 68 69 70 6 7. 8 9 29 30 10 20 Productivity Productivity % Change TABLE: 2. Production YEAR: Quantity 2019 Units 1,000 Produced Labor 300 (hours) YEAR; 2020 1,000 275 50 45 Labor (unit) 10,000 11,000 Capital Invested ($) Energy KWT 3,000 2,850 Determine the productivity percentage change for each category using table 2 above. (Show your works or calculations in the space of the table provided above) (12 points)
Step by Step Solution
There are 3 Steps involved in it
1 Expert Approved Answer
Step: 1 Unlock

Question Has Been Solved by an Expert!
Get step-by-step solutions from verified subject matter experts
Step: 2 Unlock
Step: 3 Unlock