

Question: Tableau Instructions: For this case, you will create a calculation and produce the debt to equity ratio to allow you to compare and contrast
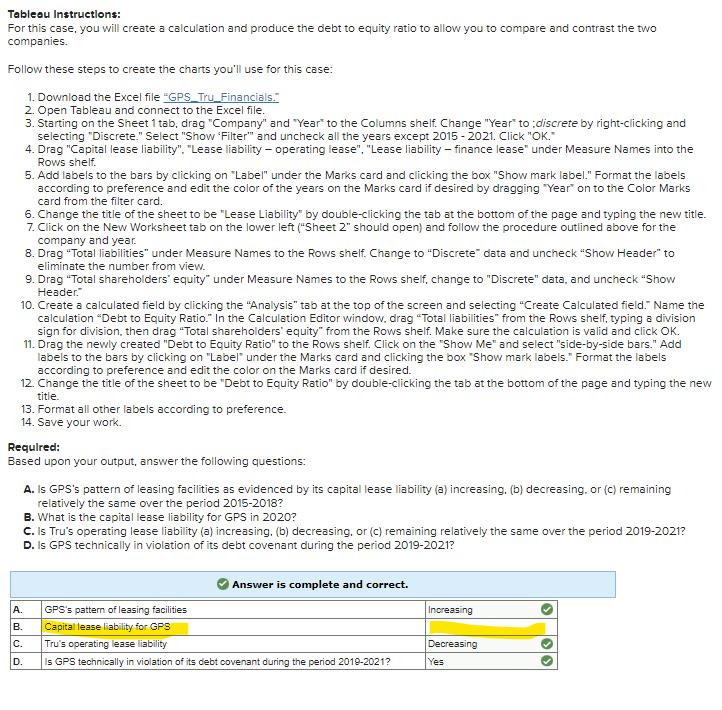
Tableau Instructions: For this case, you will create a calculation and produce the debt to equity ratio to allow you to compare and contrast the two companies. Follow these steps to create the charts you'll use for this case: 1. Download the Excel file "GPS Tru Financials." 2. Open Tableau and connect to the Excel file. 3. Starting on the Sheet 1 tab, drag "Company" and "Year" to the Columns shelf. Change "Year" to discrete by right-clicking and selecting "Discrete." Select "Show 'Filter" and uncheck all the years except 2015-2021. Click "OK." 4. Drag "Capital lease liability". "Lease liability - operating lease". "Lease liability - finance lease" under Measure Names into the Rows shelf. 5. Add labels to the bars by clicking on "Label" under the Marks card and clicking the box "Show mark label." Format the labels according to preference and edit the color of the years on the Marks card if desired by dragging "Year" on to the Color Marks card from the filter card. 6. Change the title of the sheet to be "Lease Liability" by double-clicking the tab at the bottom of the page and typing the new title. 7. Click on the New Worksheet tab on the lower left ("Sheet 2" should open) and follow the procedure outlined above for the company and year. 8. Drag "Total liabilities" under Measure Names to the Rows shelf. Change to "Discrete" data and uncheck "Show Header" to eliminate the number from view. 9. Drag "Total shareholders' equity" under Measure Names to the Rows shelf, change to "Discrete" data, and uncheck "Show Header." 10. Create a calculated field by clicking the "Analysis" tab at the top of the screen and selecting "Create Calculated field." Name the calculation "Debt to Equity Ratio." In the Calculation Editor window, drag "Total liabilities" from the Rows shelf, typing a division sign for division, then drag "Total shareholders' equity" from the Rows shelf. Make sure the calculation is valid and click OK. 11. Drag the newly created "Debt to Equity Ratio" to the Rows shelf. Click on the "Show Me" and select "side-by-side bars." Add labels to the bars by clicking on "Label" under the Marks card and clicking the box "Show mark labels." Format the labels according to preference and edit the color on the Marks card if desired. 12. Change the title of the sheet to be "Debt to Equity Ratio" by double-clicking the tab at the bottom of the page and typing the new title. 13. Format all other labels according to preference. 14. Save your work. Required: Based upon your output, answer the following questions: A. Is GPS's pattern of leasing facilities as evidenced by its capital lease liability (a) increasing, (b) decreasing, or (c) remaining relatively the same over the period 2015-2018? B. What is the capital lease liability for GPS in 2020? C. Is Tru's operating lease liability (a) increasing. (b) decreasing, or (c) remaining relatively the same over the period 2019-2021? D. Is GPS technically in violation of its debt covenant during the period 2019-2021? Answer is complete and correct. AR A. GPS's pattern of leasing facilities Increasing B. Capital lease liability for GPS C. Tru's operating lease liability Decreasing D. Is GPS technically in violation of its debt covenant during the period 2019-2021? Yes
Step by Step Solution
There are 3 Steps involved in it
Based on the provided instructions and the highlighted answers here is a stepbystep guide to performing the analysis and answering the questions using ... View full answer

Get step-by-step solutions from verified subject matter experts