

Question: Required: Based on the visualization you created, answer the following questions: A. What are Big Store's recelvables turnover ratios in (a) 2012 and (b) 2021?
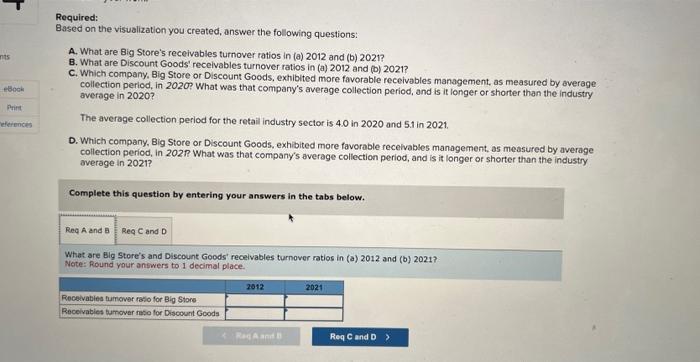
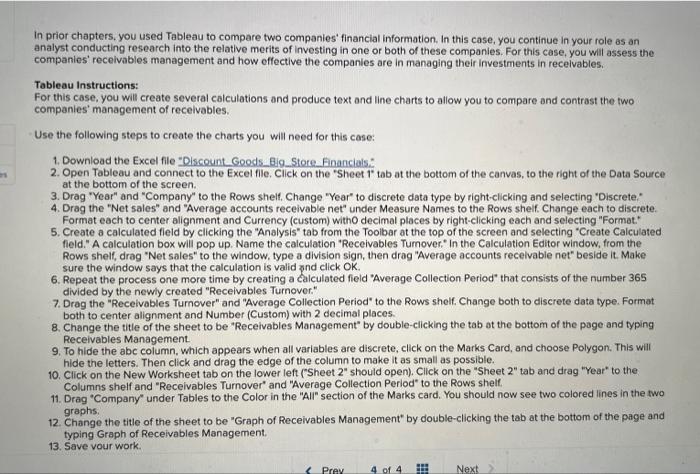
Required: Based on the visualization you created, answer the following questions: A. What are Big Store's recelvables turnover ratios in (a) 2012 and (b) 2021? B. What are Discount Goods' recelvables turnover ratios in (a) 2012 and (b) 2021? C. Which company, Big Store or Discount Goods, exthibited more favorable receivables management, as measured by overage collection period, in 2020? What was that company's average collection period, and is it longer or shorter than the industry average in 2020? The average collection period for the retail industry sector is 4.0 in 2020 and 5.1 in 2021. D. Which company, Big Store or Discount Goods, exhibited more favorable recelvables management, as measured by average collection period, in 202 What was that company's average collection period, and is it longer or shorter than the industry overage in 2021 ? Complete this question by entering your answers in the tabs below. What are Big Store's and Discount Goods' recelvables turnover ratios in (a) 2012 and (b) 2021? Note: Round your answers to I decimal place. In prior chapters, you used Tableau to compare two companies' financial information. In this case, you continue in your role as an analyst conducting research into the relative merits of investing in one or both of these companies. For this case, you will assess the companies' recelvables management and how effective the companies are in managing their investments in recelvables. Tableau Instructions: For this case, you will create several calculations and produce text and line charts to allow you to compare and contrast the two companies' management of recelvables. Use the following steps to create the charts you will need for this case: 1. Download the Excel file "Discount Goods_Big__Store Financials." 2. Open Tableau and connect to the Excel flie. Click on the "Sheet tab at the bottom of the canvas, to the right of the Data Source at the bottom of the screen. 3. Drag "Year" and "Company" to the Rows shelf, Change "Year" to discrete data type by right-clicking and selecting "Discrete." 4. Drag the "Net sales" and "Average accounts receivable net" under Measure Names to the Rows sheif. Change each to discrete. Format each to center alignment and Currency (custom) witho decimal places by right-clicking each and selecting "Formot." 5. Create a calculated field by clicking the "Analysis" tab from the Toolbar at the top of the screen and selecting "Create Calculated field." A calculation box will pop up. Name the calculation "Receivables Tumover. " in the Calculation Editor window, from the Rows shelf, drag "Net sales" to the window, type a division sign, then drag "Average accounts receivable net" beside it. Make sure the window says that the calculation is valid znd click OK. 6. Repeat the process one more time by creating a calculated field "Average Collection Period" that consists of the number 365 divided by the newly created "Receivables Turnover." 7. Drag the "Receivables Turnover" and "Average Collection Period" to the Rows shelf. Change both to discrete data type. Format both to center alignment and Number (Custom) with 2 decimal places. 8. Change the title of the sheet to be "Receivables Management" by double-clicking the tab at the bottom of the page and typing Receivables Management. 9. To hide the abc column, which appears when all variables are discrete, click on the Marks Card, and choose Polygon. This will hide the letters. Then click and drag the edge of the column to make it as small as possible. 10. Click on the New Worksheet tab on the lower left ("Sheet 2" should open). Click on the "Sheet 2" tab and drag "Year" to the Columns shelf and "Receivables Turnover" and "Average Collection Period" to the Rows shelf. 11. Drag "Company" under Tables to the Color in the "All" section of the Marks card. You should now see two colored lines in the two graphs. 12. Change the title of the sheet to be "Graph of Receivables Management" by double-clicking the tab at the bottom of the page and typing Graph of Receivables Management. Required: Based on the visualization you created, answer the following questions: A. What are Big Store's recelvables turnover ratios in (a) 2012 and (b) 2021? B. What are Discount Goods' recelvables turnover ratios in (a) 2012 and (b) 2021? C. Which company, Big Store or Discount Goods, exthibited more favorable receivables management, as measured by overage collection period, in 2020? What was that company's average collection period, and is it longer or shorter than the industry average in 2020? The average collection period for the retail industry sector is 4.0 in 2020 and 5.1 in 2021. D. Which company, Big Store or Discount Goods, exhibited more favorable recelvables management, as measured by average collection period, in 202 What was that company's average collection period, and is it longer or shorter than the industry overage in 2021 ? Complete this question by entering your answers in the tabs below. What are Big Store's and Discount Goods' recelvables turnover ratios in (a) 2012 and (b) 2021? Note: Round your answers to I decimal place. In prior chapters, you used Tableau to compare two companies' financial information. In this case, you continue in your role as an analyst conducting research into the relative merits of investing in one or both of these companies. For this case, you will assess the companies' recelvables management and how effective the companies are in managing their investments in recelvables. Tableau Instructions: For this case, you will create several calculations and produce text and line charts to allow you to compare and contrast the two companies' management of recelvables. Use the following steps to create the charts you will need for this case: 1. Download the Excel file "Discount Goods_Big__Store Financials." 2. Open Tableau and connect to the Excel flie. Click on the "Sheet tab at the bottom of the canvas, to the right of the Data Source at the bottom of the screen. 3. Drag "Year" and "Company" to the Rows shelf, Change "Year" to discrete data type by right-clicking and selecting "Discrete." 4. Drag the "Net sales" and "Average accounts receivable net" under Measure Names to the Rows sheif. Change each to discrete. Format each to center alignment and Currency (custom) witho decimal places by right-clicking each and selecting "Formot." 5. Create a calculated field by clicking the "Analysis" tab from the Toolbar at the top of the screen and selecting "Create Calculated field." A calculation box will pop up. Name the calculation "Receivables Tumover. " in the Calculation Editor window, from the Rows shelf, drag "Net sales" to the window, type a division sign, then drag "Average accounts receivable net" beside it. Make sure the window says that the calculation is valid znd click OK. 6. Repeat the process one more time by creating a calculated field "Average Collection Period" that consists of the number 365 divided by the newly created "Receivables Turnover." 7. Drag the "Receivables Turnover" and "Average Collection Period" to the Rows shelf. Change both to discrete data type. Format both to center alignment and Number (Custom) with 2 decimal places. 8. Change the title of the sheet to be "Receivables Management" by double-clicking the tab at the bottom of the page and typing Receivables Management. 9. To hide the abc column, which appears when all variables are discrete, click on the Marks Card, and choose Polygon. This will hide the letters. Then click and drag the edge of the column to make it as small as possible. 10. Click on the New Worksheet tab on the lower left ("Sheet 2" should open). Click on the "Sheet 2" tab and drag "Year" to the Columns shelf and "Receivables Turnover" and "Average Collection Period" to the Rows shelf. 11. Drag "Company" under Tables to the Color in the "All" section of the Marks card. You should now see two colored lines in the two graphs. 12. Change the title of the sheet to be "Graph of Receivables Management" by double-clicking the tab at the bottom of the page and typing Graph of Receivables Management
Step by Step Solution
There are 3 Steps involved in it

Get step-by-step solutions from verified subject matter experts