Question: Tables 1 and 2 contain the data from the first part of the project. Table 1 presents the amount of vaccine demand for each demand
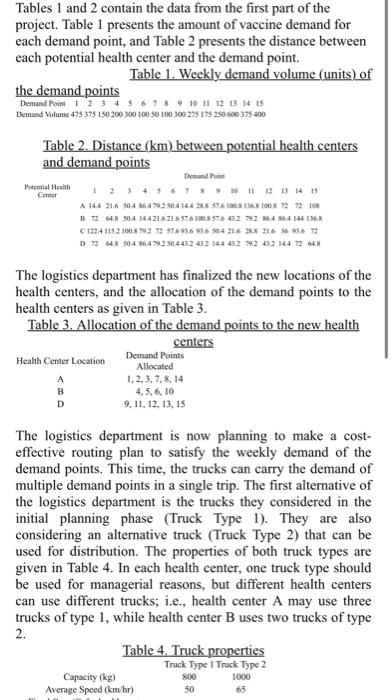
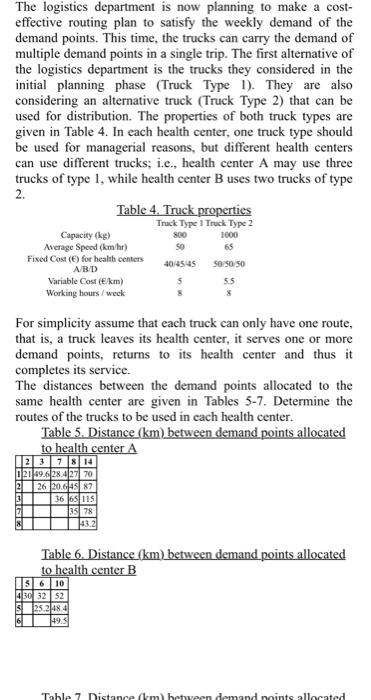
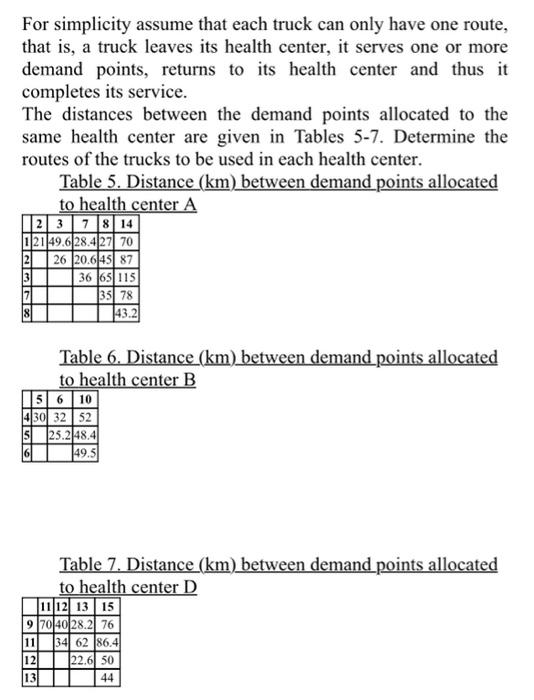
Tables 1 and 2 contain the data from the first part of the project. Table 1 presents the amount of vaccine demand for each demand point, and Table 2 presents the distance between each potential health center and the demand point. Table 1. Weekly demand volume (units) of the demand points Demand Point 1234 5 6 7 8 9 10 11 12 13 14 15 Demand Volume 475 375 150 200 300 100 50 100 300 275 175 256 60 375 400 Table 2. Distance (km) between potential health centers and demand points Demand Potential alth Center +2+36 70 11 12 13 #15 A 144 21.6 50.486 479.250.414.4 2 ST1003 SOOS 72 72 10 B 72 648 504 56421621657.61005575432 2 54 56.4 14 136. C122.4 1152100870272 7696 16984216 36 36 36 72 D 64% 50.4 86.47950:4432 412 143 132 1312 432 144 724 The logistics department has finalized the new locations of the health centers, and the allocation of the demand points to the health centers as given in Table 3. Table 3. Allocation of the demand points to the new health centers Health Center Location Demand Points Allocated 1,2,3,7,8,14 4,5,6,10 9, 11, 12, 13, 15 D The logistics department is now planning to make a cost- effective routing plan to satisfy the weekly demand of the demand points. This time, the trucks can carry the demand of multiple demand points in a single trip. The first alternative of the logistics department is the trucks they considered in the initial planning phase (Truck Type 1). They are also considering an alternative truck (Truck Type 2) that can be used for distribution. The properties of both truck types are given in Table 4. In each health center, one truck type should be used for managerial reasons, but different health centers can use different trucks; i.e., health center A may use three trucks of type 1, while health center B uses two trucks of type 2. Table 4. Truck properties Capacity (kg) Average Speed (km/hr) Truck Type 1 Truck Type 2 800 1000 50 65 The logistics department is now planning to make a cost- effective routing plan to satisfy the weekly demand of the demand points. This time, the trucks can carry the demand of multiple demand points in a single trip. The first alternative of the logistics department is the trucks they considered in the initial planning phase (Truck Type 1). They are also considering an alternative truck (Truck Type 2) that can be used for distribution. The properties of both truck types are given in Table 4. In each health center, one truck type should be used for managerial reasons, but different health centers can use different trucks; i.e., health center A may use three trucks of type 1, while health center B uses two trucks of type 2. Table 4. Truck properties Track Type 1 Truck Type 2 Capacity (kg) Average Speed (km/h) 65 Fixed Cost (e) for health centers AB/D 404545 505050 Variable Cost (km) Working hours / week 1000 800 SO 55 For simplicity assume that each truck can only have one route, that is, a truck leaves its health center, it serves one or more demand points, returns to its health center and thus it completes its service. The distances between the demand points allocated to the same health center are given in Tables 5-7. Determine the routes of the trucks to be used in each health center. Table 5. Distance (km) between demand points allocated to health center A 3 73 14 021 49.6284 27 70 226 20:6 45 87 366115 3 3578 143.21 Table 6. Distance (km) between demand points allocated to health center B 5 6 10 430 32 52 s 25.248.4 149.5 Table 7 Distance (m) between demand points allocated For simplicity assume that each truck can only have one route, that is, a truck leaves its health center, it serves one or more demand points, returns to its health center and thus it completes its service. The distances between the demand points allocated to the same health center are given in Tables 5-7. Determine the routes of the trucks to be used in each health center. Table 5. Distance (km) between demand points allocated to health center A 2 3 7 8 14 121 49.628.427 70 226 20.6 45 87 36 65 115 135 78 43.21 INN Table 6. Distance (km) between demand points allocated to health center B 5 6 10 430 32 52 $25.2 48.4 49.5 16 Table 7. Distance (km) between demand points allocated to health center D 11 12 13 15 9 704028.2 76 11 34 62 86.4 22.650 131 121 44


