

Question: Tables 1 and 2 contain the data from the first part of the project. Table 1 presents the amount of vaccine demand for each demand
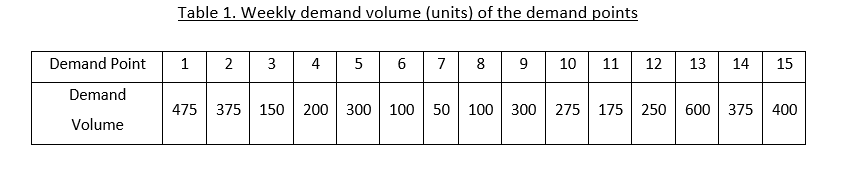
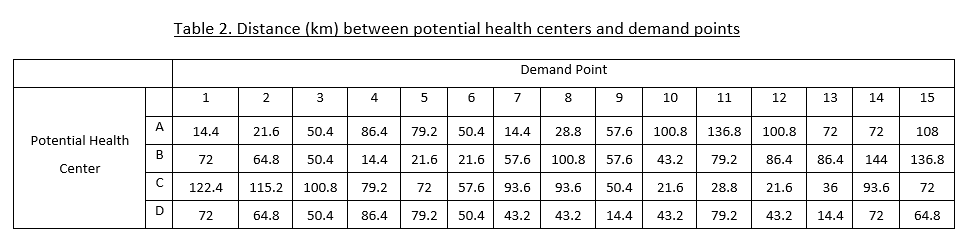
Tables 1 and 2 contain the data from the first part of the project. Table 1 presents the amount of vaccine demand for each demand point, and Table 2 presents the distance between each potential health center and the demand point.
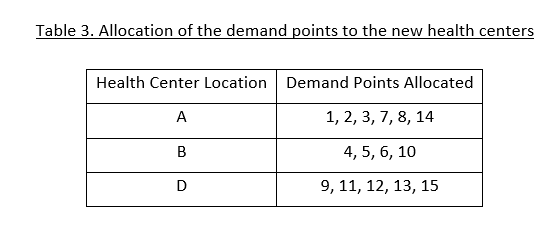
The logistics department has finalized the new locations of the health centers, and the allocation of the demand points to the health centers as given in Table 3.
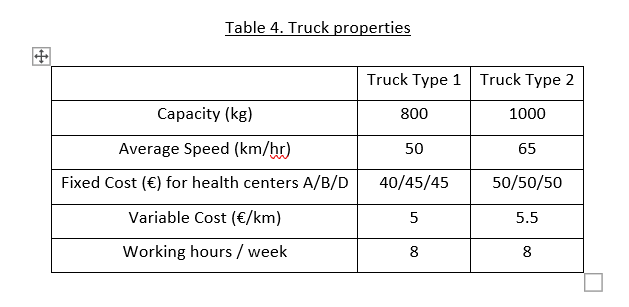
The logistics department is now planning to make a cost-effective routing plan to satisfy the weekly demand of the demand points. This time, the trucks can carry the demand of multiple demand points in a single trip. The first alternative of the logistics department is the trucks they considered in the initial planning phase (Truck Type 1). They are also considering an alternative truck (Truck Type 2) that can be used for distribution. The properties of both truck types are given in Table 4. In each health center, one truck type should be used for managerial reasons, but different health centers can use different trucks; i.e., health center A may use three trucks of type 1, while health center B uses two trucks of type 2.
For simplicity assume that each truck can only have one route, that is, a truck leaves its health center, it serves one or more demand points, returns to its health center and thus it completes its service.
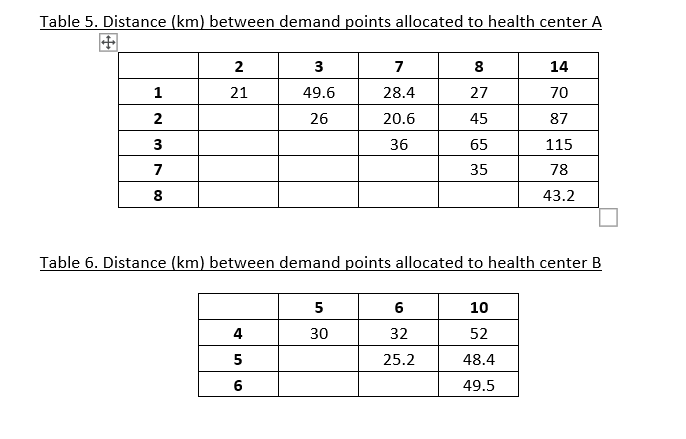
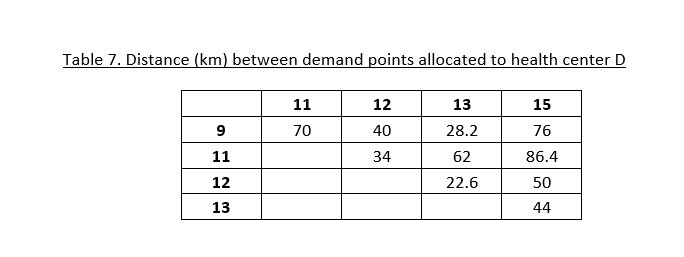
The distances between the demand points allocated to the same health center are given in Tables 5-7. Determine the routes of the trucks to be used in each health center.
You can use a heuristic method to solve the problem or solve it optimally. Every non-trivial solution approach can get a full grade if it is explained clearly !!!!
Table 1. Weekly demand volume (units) of the demand points 1 2 3 4 5 5 6 67 Demand Point Demand 8 | 9 | 10 | 11 12 | 13 | 14 15 475 375 150 200 300 100 50 100 300 275 175 250 600 375 400 Volume Table 2. Distance (km) between potential health centers and demand points Demand Point 1 2 3 4 5 6 6 7 7 8 9 10 11 12 13 14 15 A 14.4 21.6 50.4 86.4 79.2 50.4 14.4 28.8 57.6 100.8 136.8 100.8 72 72 108 Potential Health B 72 64.8 50.4 14.4 21.6 21.6 57.6 100.8 57.6 43.2 79.2 86.4 86.4 144 136.8 Center 122.4 115.2 100.8 79.2 72 57.6 93.6 93.6 50.4 21.6 28.8 21.6 36 93.6 72 D 72 64.8 50.4 86.4 79.2 50.4 43.2 43.2 14.4 43.2 79.2 43.2 14.4 72 64.8 Table 3. Allocation of the demand points to the new health centers Health Center Location Demand Points Allocated A 1, 2, 3, 7, 8, 14 B 4, 5, 6, 10 9, 11, 12, 13, 15 D Table 4. Truck properties Truck Type 1 Truck Type 2 Capacity (kg) 800 1000 50 65 Average Speed (km/hr) Fixed Cost () for health centers A/B/D 40/45/45 50/50/50 Variable Cost (/km) 5 5.5 Working hours / week 8 8 Table 5. Distance (km) between demand points allocated to health center A 3 8 14 2. 21 7 28.4 1 49.6 70 27 45 2 26 20.6 87 36 65 115 3 7 8 35 78 00 43.2 Table 6. Distance (km) between demand points allocated to health center B 10 5 30 6 32 4 52 25.2 48.4 5 6 49.5 Table 7. Distance (km) between demand points allocated to health center D 11 15 13 28.2 9 12 40 34 70 11 62 76 86.4 50 22.6 12 13 44Step by Step Solution
There are 3 Steps involved in it

Get step-by-step solutions from verified subject matter experts