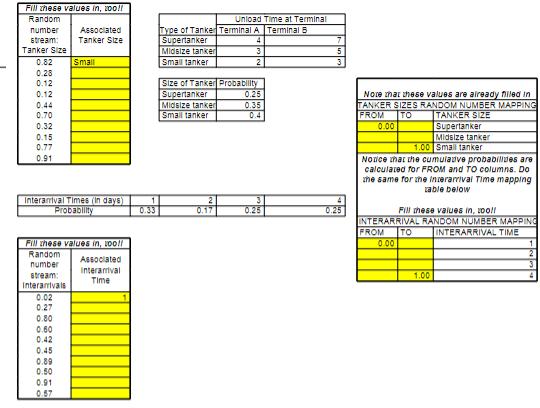
Tankers arrive at an oil port with a discrete empirical distribution of interarrival times: Interarrival Times (in
Question:
Tankers arrive at an oil port with a discrete empirical distribution of interarrival times:
Interarrival Times (in days) | 1 | 2 | 3 | 4 |
Probability | .33 | .17 | .25 | .25 |
There are three sizes of tanker: Super, Midsize, and Small. The size of tankers is distributed as follows:
Size of Tanker | Supertanker | Midsize tanker | Small tanker |
Probability | .25 | .35 | .40 |
The port has two terminals, A and B. Terminal A is more efficient than terminal B, and it is used first when both terminals are empty. The time it takes to unload a tanker is deterministic and depends on its size as follows:
Type of Tanker | Unload Time at Terminal (in days) | |
Terminal A | Terminal B | |
Supertanker | 4 | 7 |
Midsize tanker | 3 | 5 |
Small tanker | 2 | 3 |
Arriving tankers form a single waiting line (first-come, first-serve) in the port area until either terminal becomes available. Terminal assignments are not made until the terminal is available.
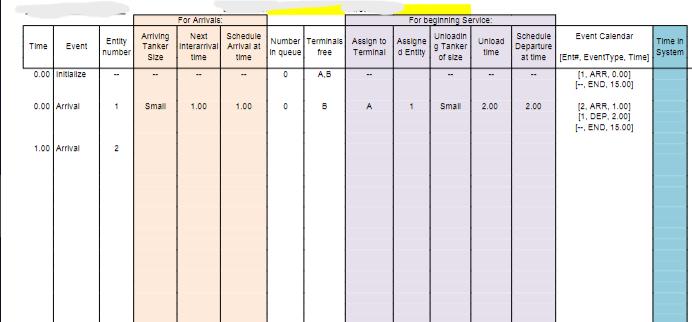
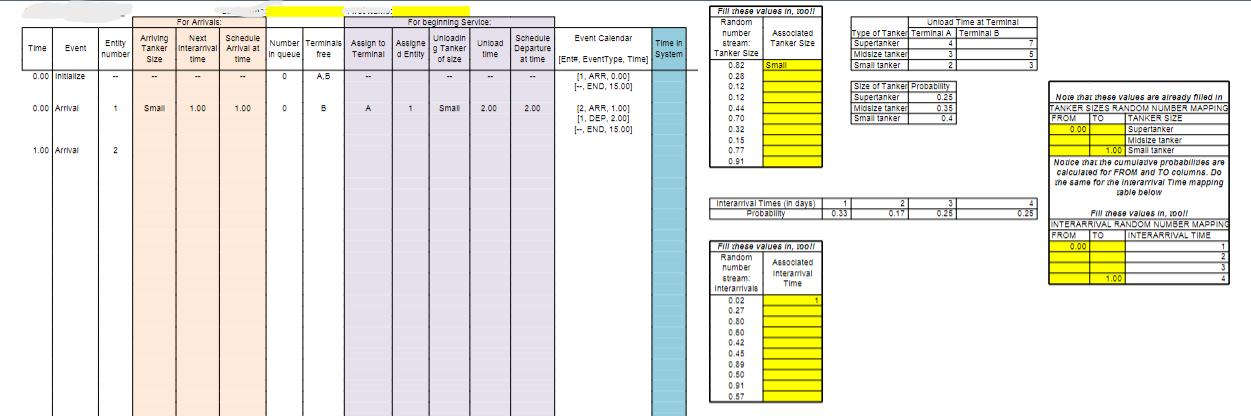
Complete the given spreadsheet template by simulating all arrival and departure events through day 15. Two random number streams have been provided on the spreadsheet: one for determining tanker sizes and the other for determining interarrival times. Outcomes from the distribution tables should be assigned in the order that they are shown in the table. For example, a random number of zero maps to the first outcome on a table, and a random number of one maps to the last outcome. Make sure that you enter the “Time in System” (column O) of an entity in case of a departure event.
NOTE: If two events occur at the same time, introduce the DEPARTURE EVENT first!
Expert Answer:
ANSWER ATTACHED IMAGE Consider the simulation problem of two terminal oil ports Tankers of size supe... View the full answer