

Question: Task 1-1) Create an I-MR control charts that show before and after situations and highlights the improvements in added time of departures. Use Excel to
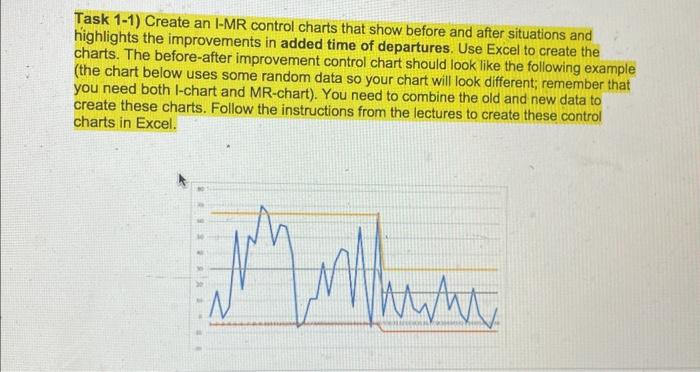
Task 1-1) Create an I-MR control charts that show before and after situations and highlights the improvements in added time of departures. Use Excel to create the charts. The before-after improvement control chart should look like the following example (the chart below uses some random data so your chart will look different; remember that you need both l-chart and MR-chart). You need to combine the old and new data to create these charts. Follow the instructions from the lectures to create these control charts in Excel. Explain what you understand from these charts. Is the process in control after improvements? Task 1-1) Create an I-MR control charts that show before and after situations and highlights the improvements in added time of departures. Use Excel to create the charts. The before-after improvement control chart should look like the following example (the chart below uses some random data so your chart will look different; remember that you need both l-chart and MR-chart). You need to combine the old and new data to create these charts. Follow the instructions from the lectures to create these control charts in Excel. Explain what you understand from these charts. Is the process in control after improvements
Step by Step Solution
There are 3 Steps involved in it

Get step-by-step solutions from verified subject matter experts