

Question: Task #2: Recording and Documenting Data - 10 points M&M Colors: Skittle Colors: Record the color distribution of your Skittles in the table below. Part
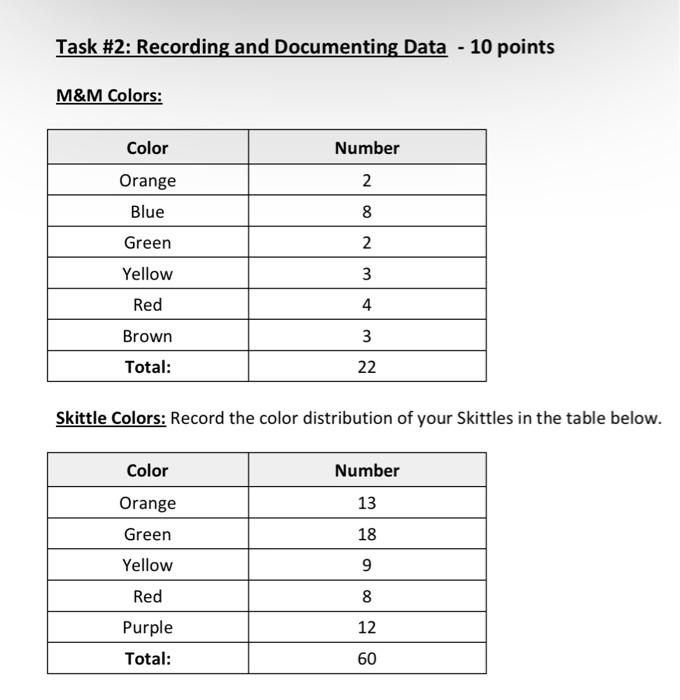
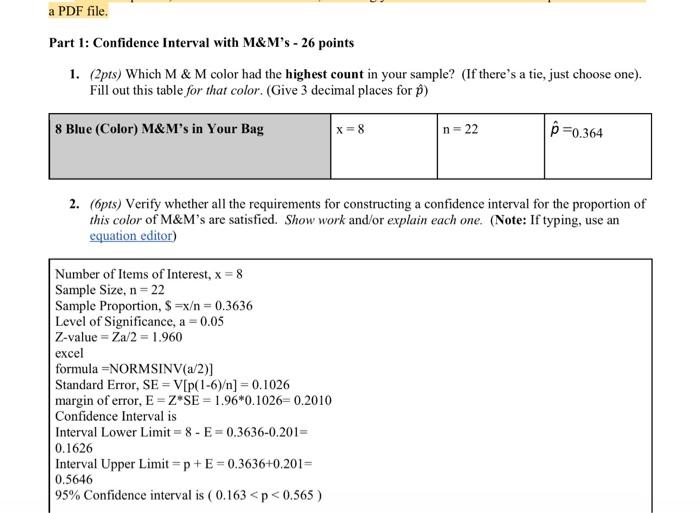
Task \#2: Recording and Documenting Data - 10 points M\&M Colors: Skittle Colors: Record the color distribution of your Skittles in the table below. Part 1: Confidence Interval with M\&M's - 26 points 1. (2pts) Which M \& M color had the highest count in your sample? (If there's a tie, just choose one). Fill out this table for that color. (Give 3 decimal places for p^ ) 2. (6pts) Verify whether all the requirements for constructing a confidence interval for the proportion of this color of M\&M's are satisfied. Show work and/or explain each one. (Note: If typing, use an equation editor) Number of Items of Interest, x=8 Sample Size, n=22 Sample Proportion, $=x=0.3636 Level of Significance, a=0.05 Z-value =Za/2=1.960 excel formula = NORMSINV (a/2)] Standard Error, SE=V[p(16)]=0.1026 margin of error, E=ZSE=1.960.1026=0.2010 Confidence Interval is Interval Lower Limit =8E=0.36360.201= 0.1626 Interval Upper Limit =p+E=0.3636+0.201= 0.5646 95% Confidence interval is (0.163
Step by Step Solution
There are 3 Steps involved in it

Get step-by-step solutions from verified subject matter experts