

Question: Task 2-1) Create a box plot that compares the total delay for arrival of old data and new data for the end stations (NYC and
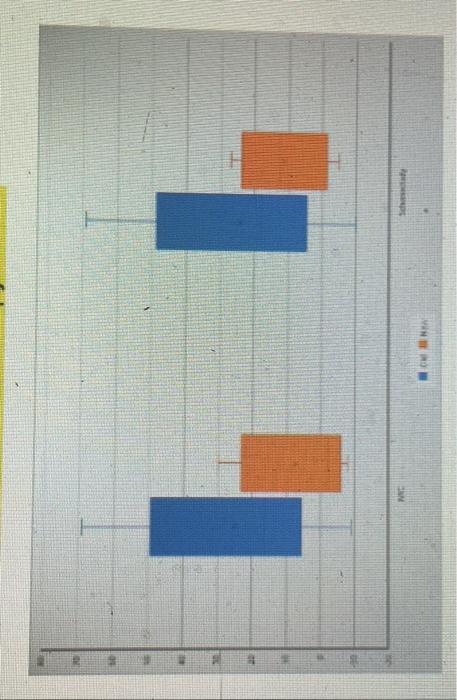
Task 2-1) Create a box plot that compares the total delay for arrival of old data and new data for the end stations (NYC and Schenectady). The box plot should look like the following example (the chart below uses some random data so your chart will look different). Use Excel to create the chart and copy it here. 11
Step by Step Solution
There are 3 Steps involved in it
1 Expert Approved Answer
Step: 1 Unlock

Question Has Been Solved by an Expert!
Get step-by-step solutions from verified subject matter experts
Step: 2 Unlock
Step: 3 Unlock