

Question: TrainCo Timetable NYC-Schenectody TrainCo Timetable Schenectady-NYC Task 2-1) Create a box plot that compares the total delay for arrival of old data and new data
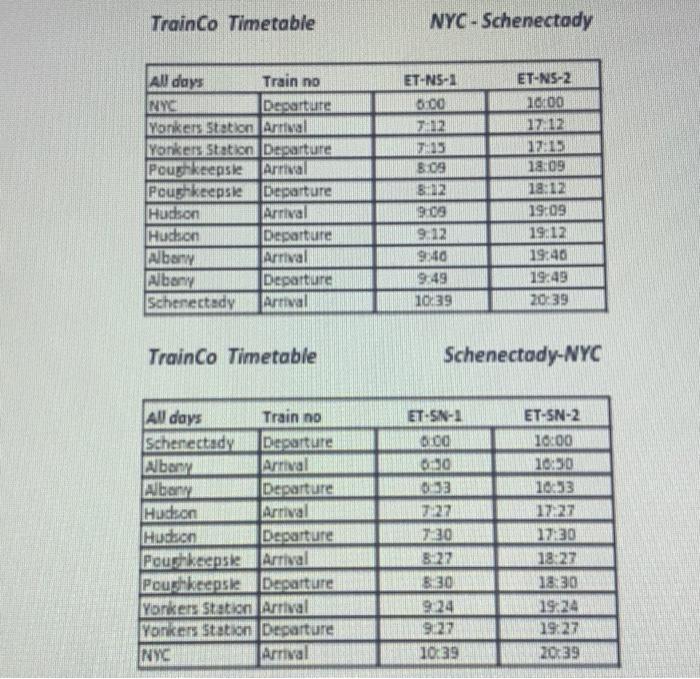
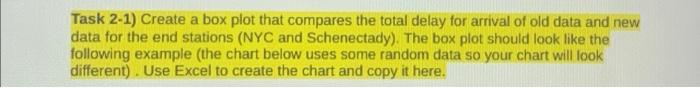
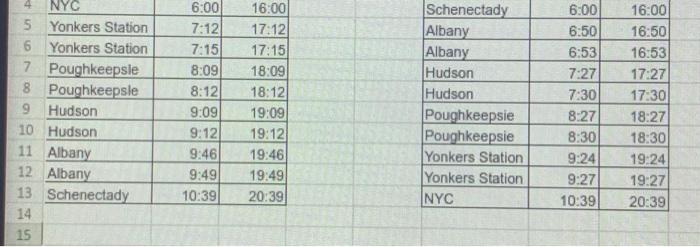
TrainCo Timetable NYC-Schenectody TrainCo Timetable Schenectady-NYC Task 2-1) Create a box plot that compares the total delay for arrival of old data and new data for the end stations (NYC and Schenectady). The box plot should look like the following example (the chart below uses some random data so your chart will look different). Use Excel to create the chart and copy it here. \begin{tabular}{c|r|r|r|} \hline 5 & NYC & 6:00 & 16:00 \\ \hline Yonkers Station & 7:12 & 17:12 \\ \hline 6 & Yonkers Station & 7:15 & 17:15 \\ \hline 7 & Poughkeepsle & 8:09 & 18:09 \\ \hline 8 & Poughkeepsle & 8:12 & 18:12 \\ \hline 9 & Hudson & 9:09 & 19:09 \\ \hline 10 & Hudson & 9:12 & 19:12 \\ \hline 11 & Albany & 9:46 & 19:46 \\ \hline 12 & Albany & 9:49 & 19:49 \\ \hline 13 & Schenectady & 10:39 & 20:39 \\ \hline \end{tabular} \begin{tabular}{|l|r|r|} \hline Schenectady & 6:00 & 16:00 \\ \hline Albany & 6:50 & 16:50 \\ \hline Albany & 6:53 & 16:53 \\ \hline Hudson & 7:27 & 17:27 \\ \hline Hudson & 7:30 & 17:30 \\ \hline Poughkeepsie & 8:27 & 18:27 \\ \hline Poughkeepsie & 8:30 & 18:30 \\ \hline Yonkers Station & 9:24 & 19:24 \\ \hline Yonkers Station & 9:27 & 19:27 \\ \hline NYC & 10:39 & 20:39 \\ \hline \end{tabular} TrainCo Timetable NYC-Schenectody TrainCo Timetable Schenectady-NYC Task 2-1) Create a box plot that compares the total delay for arrival of old data and new data for the end stations (NYC and Schenectady). The box plot should look like the following example (the chart below uses some random data so your chart will look different). Use Excel to create the chart and copy it here. \begin{tabular}{c|r|r|r|} \hline 5 & NYC & 6:00 & 16:00 \\ \hline Yonkers Station & 7:12 & 17:12 \\ \hline 6 & Yonkers Station & 7:15 & 17:15 \\ \hline 7 & Poughkeepsle & 8:09 & 18:09 \\ \hline 8 & Poughkeepsle & 8:12 & 18:12 \\ \hline 9 & Hudson & 9:09 & 19:09 \\ \hline 10 & Hudson & 9:12 & 19:12 \\ \hline 11 & Albany & 9:46 & 19:46 \\ \hline 12 & Albany & 9:49 & 19:49 \\ \hline 13 & Schenectady & 10:39 & 20:39 \\ \hline \end{tabular} \begin{tabular}{|l|r|r|} \hline Schenectady & 6:00 & 16:00 \\ \hline Albany & 6:50 & 16:50 \\ \hline Albany & 6:53 & 16:53 \\ \hline Hudson & 7:27 & 17:27 \\ \hline Hudson & 7:30 & 17:30 \\ \hline Poughkeepsie & 8:27 & 18:27 \\ \hline Poughkeepsie & 8:30 & 18:30 \\ \hline Yonkers Station & 9:24 & 19:24 \\ \hline Yonkers Station & 9:27 & 19:27 \\ \hline NYC & 10:39 & 20:39 \\ \hline \end{tabular}
Step by Step Solution
There are 3 Steps involved in it

Get step-by-step solutions from verified subject matter experts