

Question: Task 5, research question and error bar plot attached Graph 40 35 30 95% CI Father's age (yrs) 25 20 175 cm or shorter Between
Task 5, research question and error bar plot attached
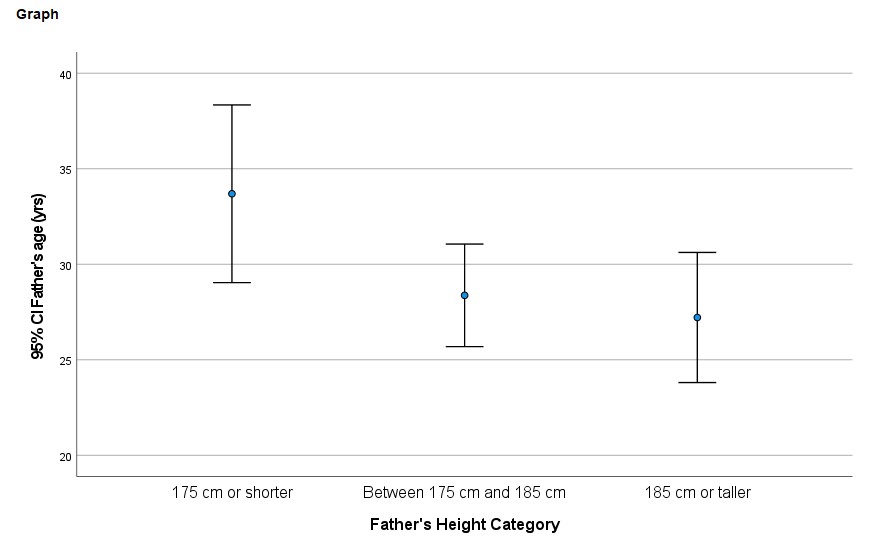
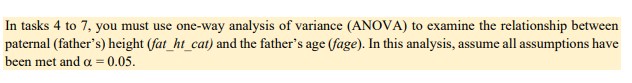
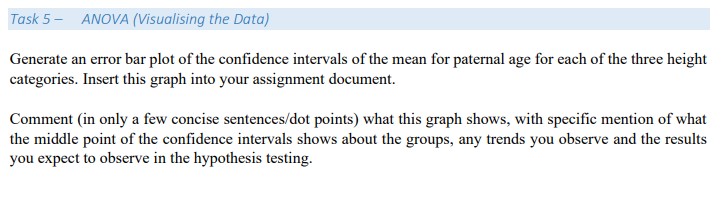
Graph 40 35 30 95% CI Father's age (yrs) 25 20 175 cm or shorter Between 175 cm and 185 cm 185 cm or taller Father's Height CategoryIn tasks 4 to 7, you must use one-way analysis of variance (ANOVA) to examine the relationship between paternal (father's) height (far_hr car) and the father's age (fage). In this analysis, assume all assumptions have been met and a = 0.05.Task 5 - ANOVA (Visualising the Data) Generate an error bar plot of the confidence intervals of the mean for paternal age for each of the three height categories. Insert this graph into your assignment document. Comment (in only a few concise sentences/dot points) what this graph shows, with specific mention of what the middle point of the confidence intervals shows about the groups, any trends you observe and the results you expect to observe in the hypothesis testing
Step by Step Solution
There are 3 Steps involved in it

Get step-by-step solutions from verified subject matter experts