

Question: Task 8 Please thorough explanation (2-3 paragraphs total in length) I'll be sure to leave a thumbs up, thank you! Statistical Gart Lyb Extend do
Task 8 Please thorough explanation (2-3 paragraphs total in length) I'll be sure to leave a thumbs up, thank you!
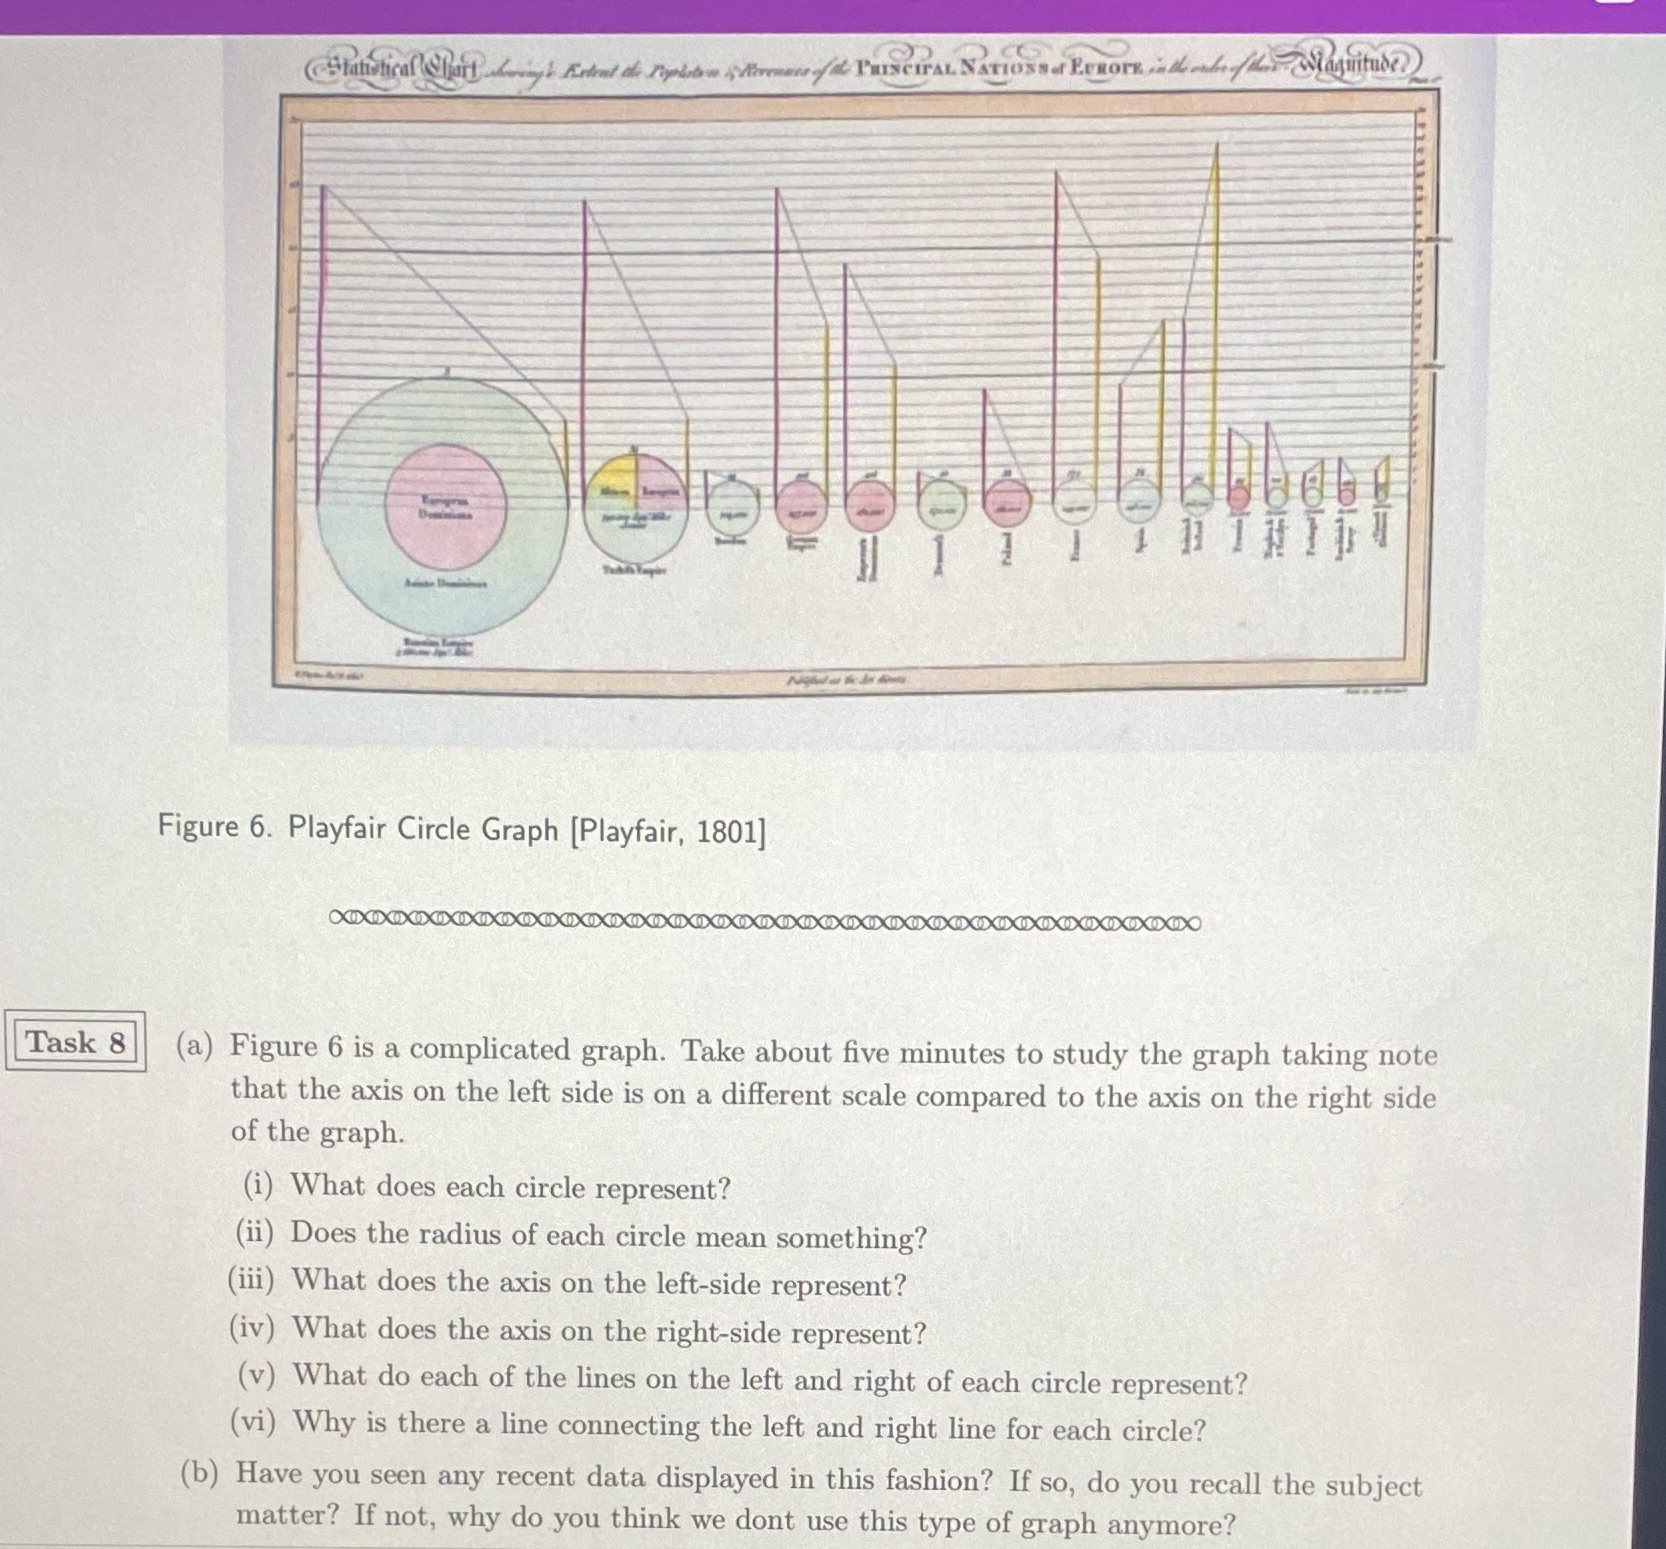
Statistical Gart Lyb Extend do Peoplebe A formeans of & PRINCIPAL NATIONSof EUROPEind who/ L- Magnitude Figure 6. Playfair Circle Graph [Playfair, 1801] Task 8 (a) Figure 6 is a complicated graph. Take about five minutes to study the graph taking note that the axis on the left side is on a different scale compared to the axis on the right side of the graph. (i) What does each circle represent? (ii) Does the radius of each circle mean something? (iii) What does the axis on the left-side represent? (iv) What does the axis on the right-side represent? (v) What do each of the lines on the left and right of each circle represent? (vi) Why is there a line connecting the left and right line for each circle? (b) Have you seen any recent data displayed in this fashion? If so, do you recall the subject matter? If not, why do you think we dont use this type of graph anymore
Step by Step Solution
There are 3 Steps involved in it

Get step-by-step solutions from verified subject matter experts