

Question: T.Bosed Confidence interval Weth Contidence menul c. d. We are going to what the null hypothesis e. The conclusion of he Fest of Hypothess: t-Test
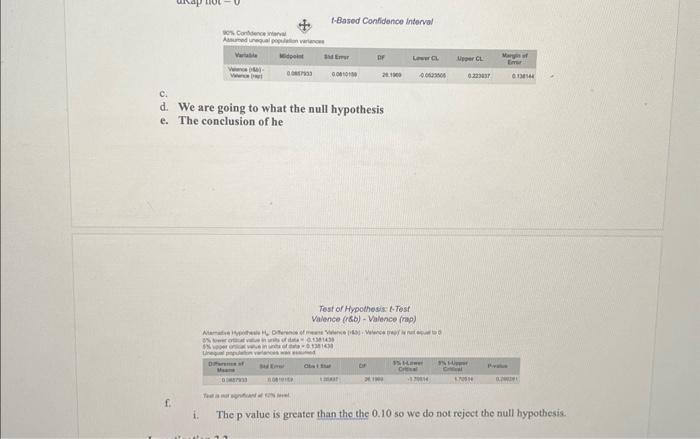
T.Bosed Confidence interval Weth Contidence menul c. d. We are going to what the null hypothesis e. The conclusion of he Fest of Hypothess: t-Test Valence (rab) - Valence (nap) f. i. The p value is greater than the the 0.10 so we do not reject the null bypothesis. Investigation 3.1: Valence Differences Between R\&B and Rap Genres (Independent) A music fan claims that R&B songs and Rap songs differ in terms of their positivity. The individual collected two independent random samples from the population of all songs on Spotify. Fifteen R\&B songs and another fifteen Rap songs were collected and their Valence was recorded. Remember, the variable Valence is measured on a 0 to 1 scale. Songs with high valence sound more positive (c.g. happy, cheerful, cuphoric), while songs with low valence sound more negative (e.g. sad, depressed, angry). We will subtract (R\&B-Rap) and use the 10% significance level. Assume the Central Limit Theorem conditions hold. The data set is called RBRapSample31. Please import the data sct into Rguroo or find it in our group. a) Define the population parameter in context and symbols in one sentence. b) State the bypotheses you would use to test the claim that a difference exists in the mean Valence between R\&B and Rap songs using correct notation. c) In this investigation, we will obtain a 90% confidence interval to make the hypothesis test decision by following these instructions. - In Rguroo, go to Analytics Analysis Mean lnference One \& Two Populations. - In se Dataset dropdown, select RRRapSample31. Remember to import the data set it you have not already. - Click the button next to the word Variable (not Variable 1). In the Variable dropdown, select Valence. For the By Factor dropdown, select Genre. - In the Summary tab, set Population 1's level to be "r\&b" and Population 2 's level to be "rap." - Now, select the fourth tab Population 1-2 and note that the Confidence Interval tab is selected Set the confidence level to be 0.90 . Then, select t-staristic under Method. Leave the Assumptions box on the right as is and click Preview. Provide either a screenshot or a copy of your confidence interval output table and state the confidence interval using proper formatting. d) Make a decision whether or not to reject the null hypothesis using the confidence interval by checking to see if the null value is captured by the confidence interval. State the decision and explanation in one sentence. c) Draw a conclusion about the claim using one or two sentences in context of the problem. f) Verify your decision by obtaining a test statistic and p-value in Rguroo, Follow the directions in part (c). Now, select the Test of Hypothesis tab. In this tab, change the significance level to 0.10 and update the aliernative hypothesis. Select r-statistic under Method. Leave the Assumptions box on the right is is. Click Previcw. Provido either a screenshot or a copy of your hypothesis test output table and verify your decision by comparing your p-value to the significanco lovel in one complete senteoce. T.Bosed Confidence interval Weth Contidence menul c. d. We are going to what the null hypothesis e. The conclusion of he Fest of Hypothess: t-Test Valence (rab) - Valence (nap) f. i. The p value is greater than the the 0.10 so we do not reject the null bypothesis. Investigation 3.1: Valence Differences Between R\&B and Rap Genres (Independent) A music fan claims that R&B songs and Rap songs differ in terms of their positivity. The individual collected two independent random samples from the population of all songs on Spotify. Fifteen R\&B songs and another fifteen Rap songs were collected and their Valence was recorded. Remember, the variable Valence is measured on a 0 to 1 scale. Songs with high valence sound more positive (c.g. happy, cheerful, cuphoric), while songs with low valence sound more negative (e.g. sad, depressed, angry). We will subtract (R\&B-Rap) and use the 10% significance level. Assume the Central Limit Theorem conditions hold. The data set is called RBRapSample31. Please import the data sct into Rguroo or find it in our group. a) Define the population parameter in context and symbols in one sentence. b) State the bypotheses you would use to test the claim that a difference exists in the mean Valence between R\&B and Rap songs using correct notation. c) In this investigation, we will obtain a 90% confidence interval to make the hypothesis test decision by following these instructions. - In Rguroo, go to Analytics Analysis Mean lnference One \& Two Populations. - In se Dataset dropdown, select RRRapSample31. Remember to import the data set it you have not already. - Click the button next to the word Variable (not Variable 1). In the Variable dropdown, select Valence. For the By Factor dropdown, select Genre. - In the Summary tab, set Population 1's level to be "r\&b" and Population 2 's level to be "rap." - Now, select the fourth tab Population 1-2 and note that the Confidence Interval tab is selected Set the confidence level to be 0.90 . Then, select t-staristic under Method. Leave the Assumptions box on the right as is and click Preview. Provide either a screenshot or a copy of your confidence interval output table and state the confidence interval using proper formatting. d) Make a decision whether or not to reject the null hypothesis using the confidence interval by checking to see if the null value is captured by the confidence interval. State the decision and explanation in one sentence. c) Draw a conclusion about the claim using one or two sentences in context of the problem. f) Verify your decision by obtaining a test statistic and p-value in Rguroo, Follow the directions in part (c). Now, select the Test of Hypothesis tab. In this tab, change the significance level to 0.10 and update the aliernative hypothesis. Select r-statistic under Method. Leave the Assumptions box on the right is is. Click Previcw. Provido either a screenshot or a copy of your hypothesis test output table and verify your decision by comparing your p-value to the significanco lovel in one complete senteoce
Step by Step Solution
There are 3 Steps involved in it

Get step-by-step solutions from verified subject matter experts