

Question: thank you so much ! can you please help me with this BME 10541: introduction to Biomedical Engineering Computing Extra Credit Assignment: Module 4 -
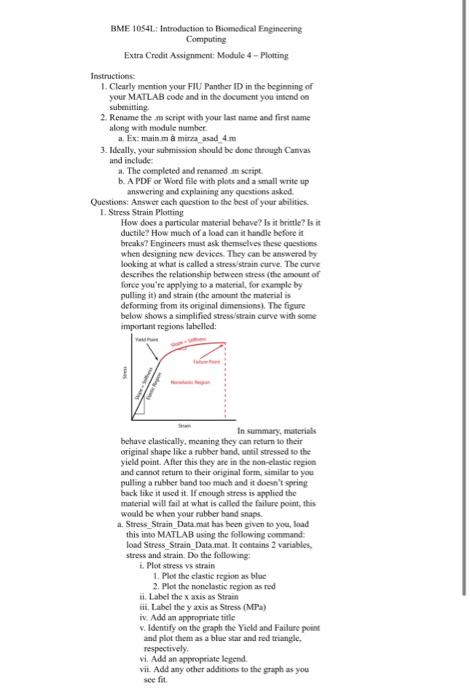
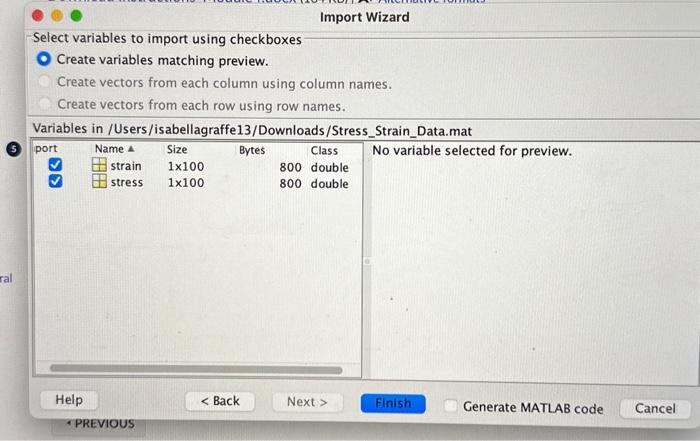
BME 10541: introduction to Biomedical Engineering Computing Extra Credit Assignment: Module 4 - Plotting Instructions: 1. Clearly mention your FIU Panther ID in the begianing of your MATLAB code and in the document you intend oo submitting. 2. Rename the ma script with your last name and first name along with module number. a. Ex: mainm a mirra asad 4m 3. Ideally, yoar submission should be done through Canvas and include: a. The completed and renamed in seript. b. A PDF or Word file with plots and a small write up answering and explainiag any questions asked. Questions: Answer each question to the best of your abilities. 1. Stress Strain Plotting How does a particular material behave? Is it britle? Is it ductile? How much of a load can in handle before it breaks? Engineers mast ask themelves these questions. when designing new devices. They can be answered by looking at what is called a stress strain curve. The curve deseribes the relationship between stress (the amount of foree you're applying to a material, for example by pulling it) and strain (the amount the material is deforming from its original dimensions). The figure below shows a simplified stress'strain eurve with some important regions labelled: behave clastically, meaning they can return io their original shape like a rubber band, until stressed to the yield point. After this they are in the non-elastic region and cannot retum to their ariginal form, similar to you pulling a rubber band too mach and it doesn't spring back like it used it. If enough stress is applied the material will fail at what is called the failure point, this would be when your rubber band snaps. a. Stress_Strain_Data mat has been given to you, load this into MATLAB usibg the following command: load Stress_Strain_Data.mat. In contains 2 variables, stress and strain. Do the following: i. Plot stress vs strain 1. Plot the elastic region as blac 2. Plot the nonelastic region as red i. Label the x axis as Strain iii. Lahel the y axis as Stress (MPa) iv. Add an appropriate title v. Identify on the graph the Yield and Failure point and plot them as a blue star and red triangle, respectively. vi. Add an appropriate legend. vie. Add any other additions to the graph as you see fit. Select variables to import using checkboxes Create variables matching preview. Create vectors from each column using column names. Create vectors from each row using row names
Step by Step Solution
There are 3 Steps involved in it

Get step-by-step solutions from verified subject matter experts