

Question: thats a calculus question below as shown by the two images -_._ __ V___.V_DV 7 7,77,-7- ,,-,,_ Recitation day/time A ball is thrown upward, and
thats a calculus question below as shown by the two images
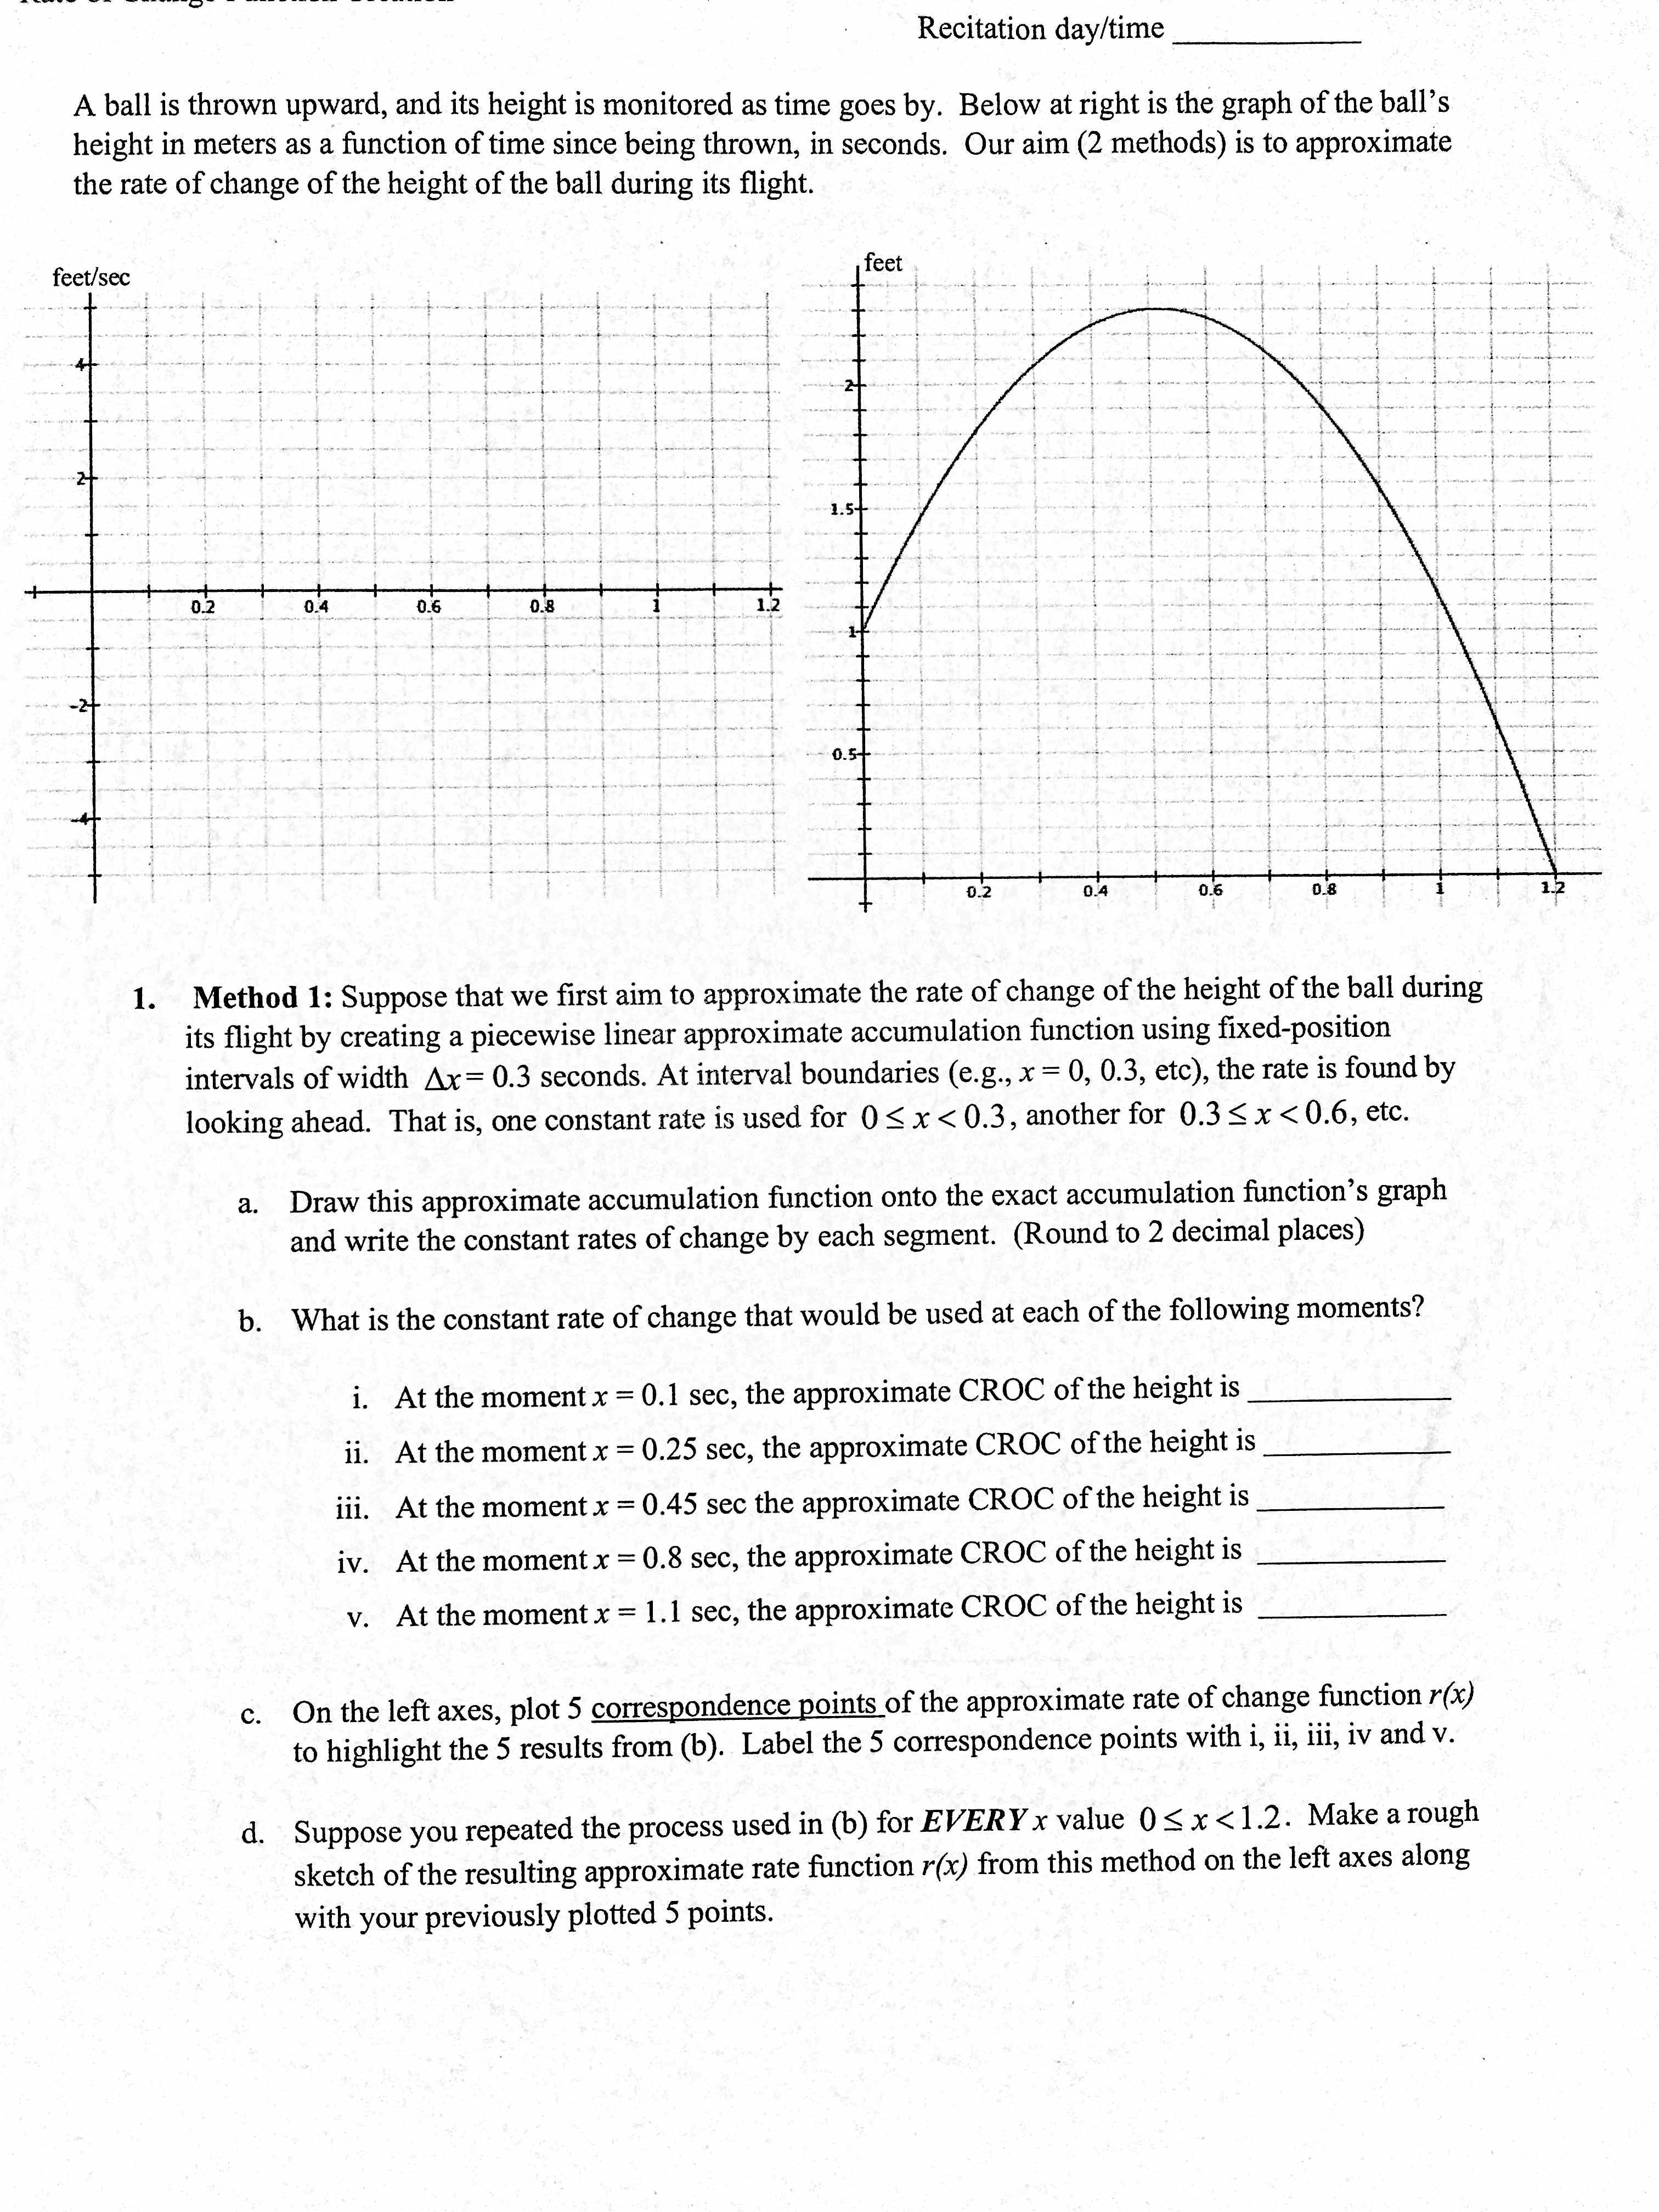
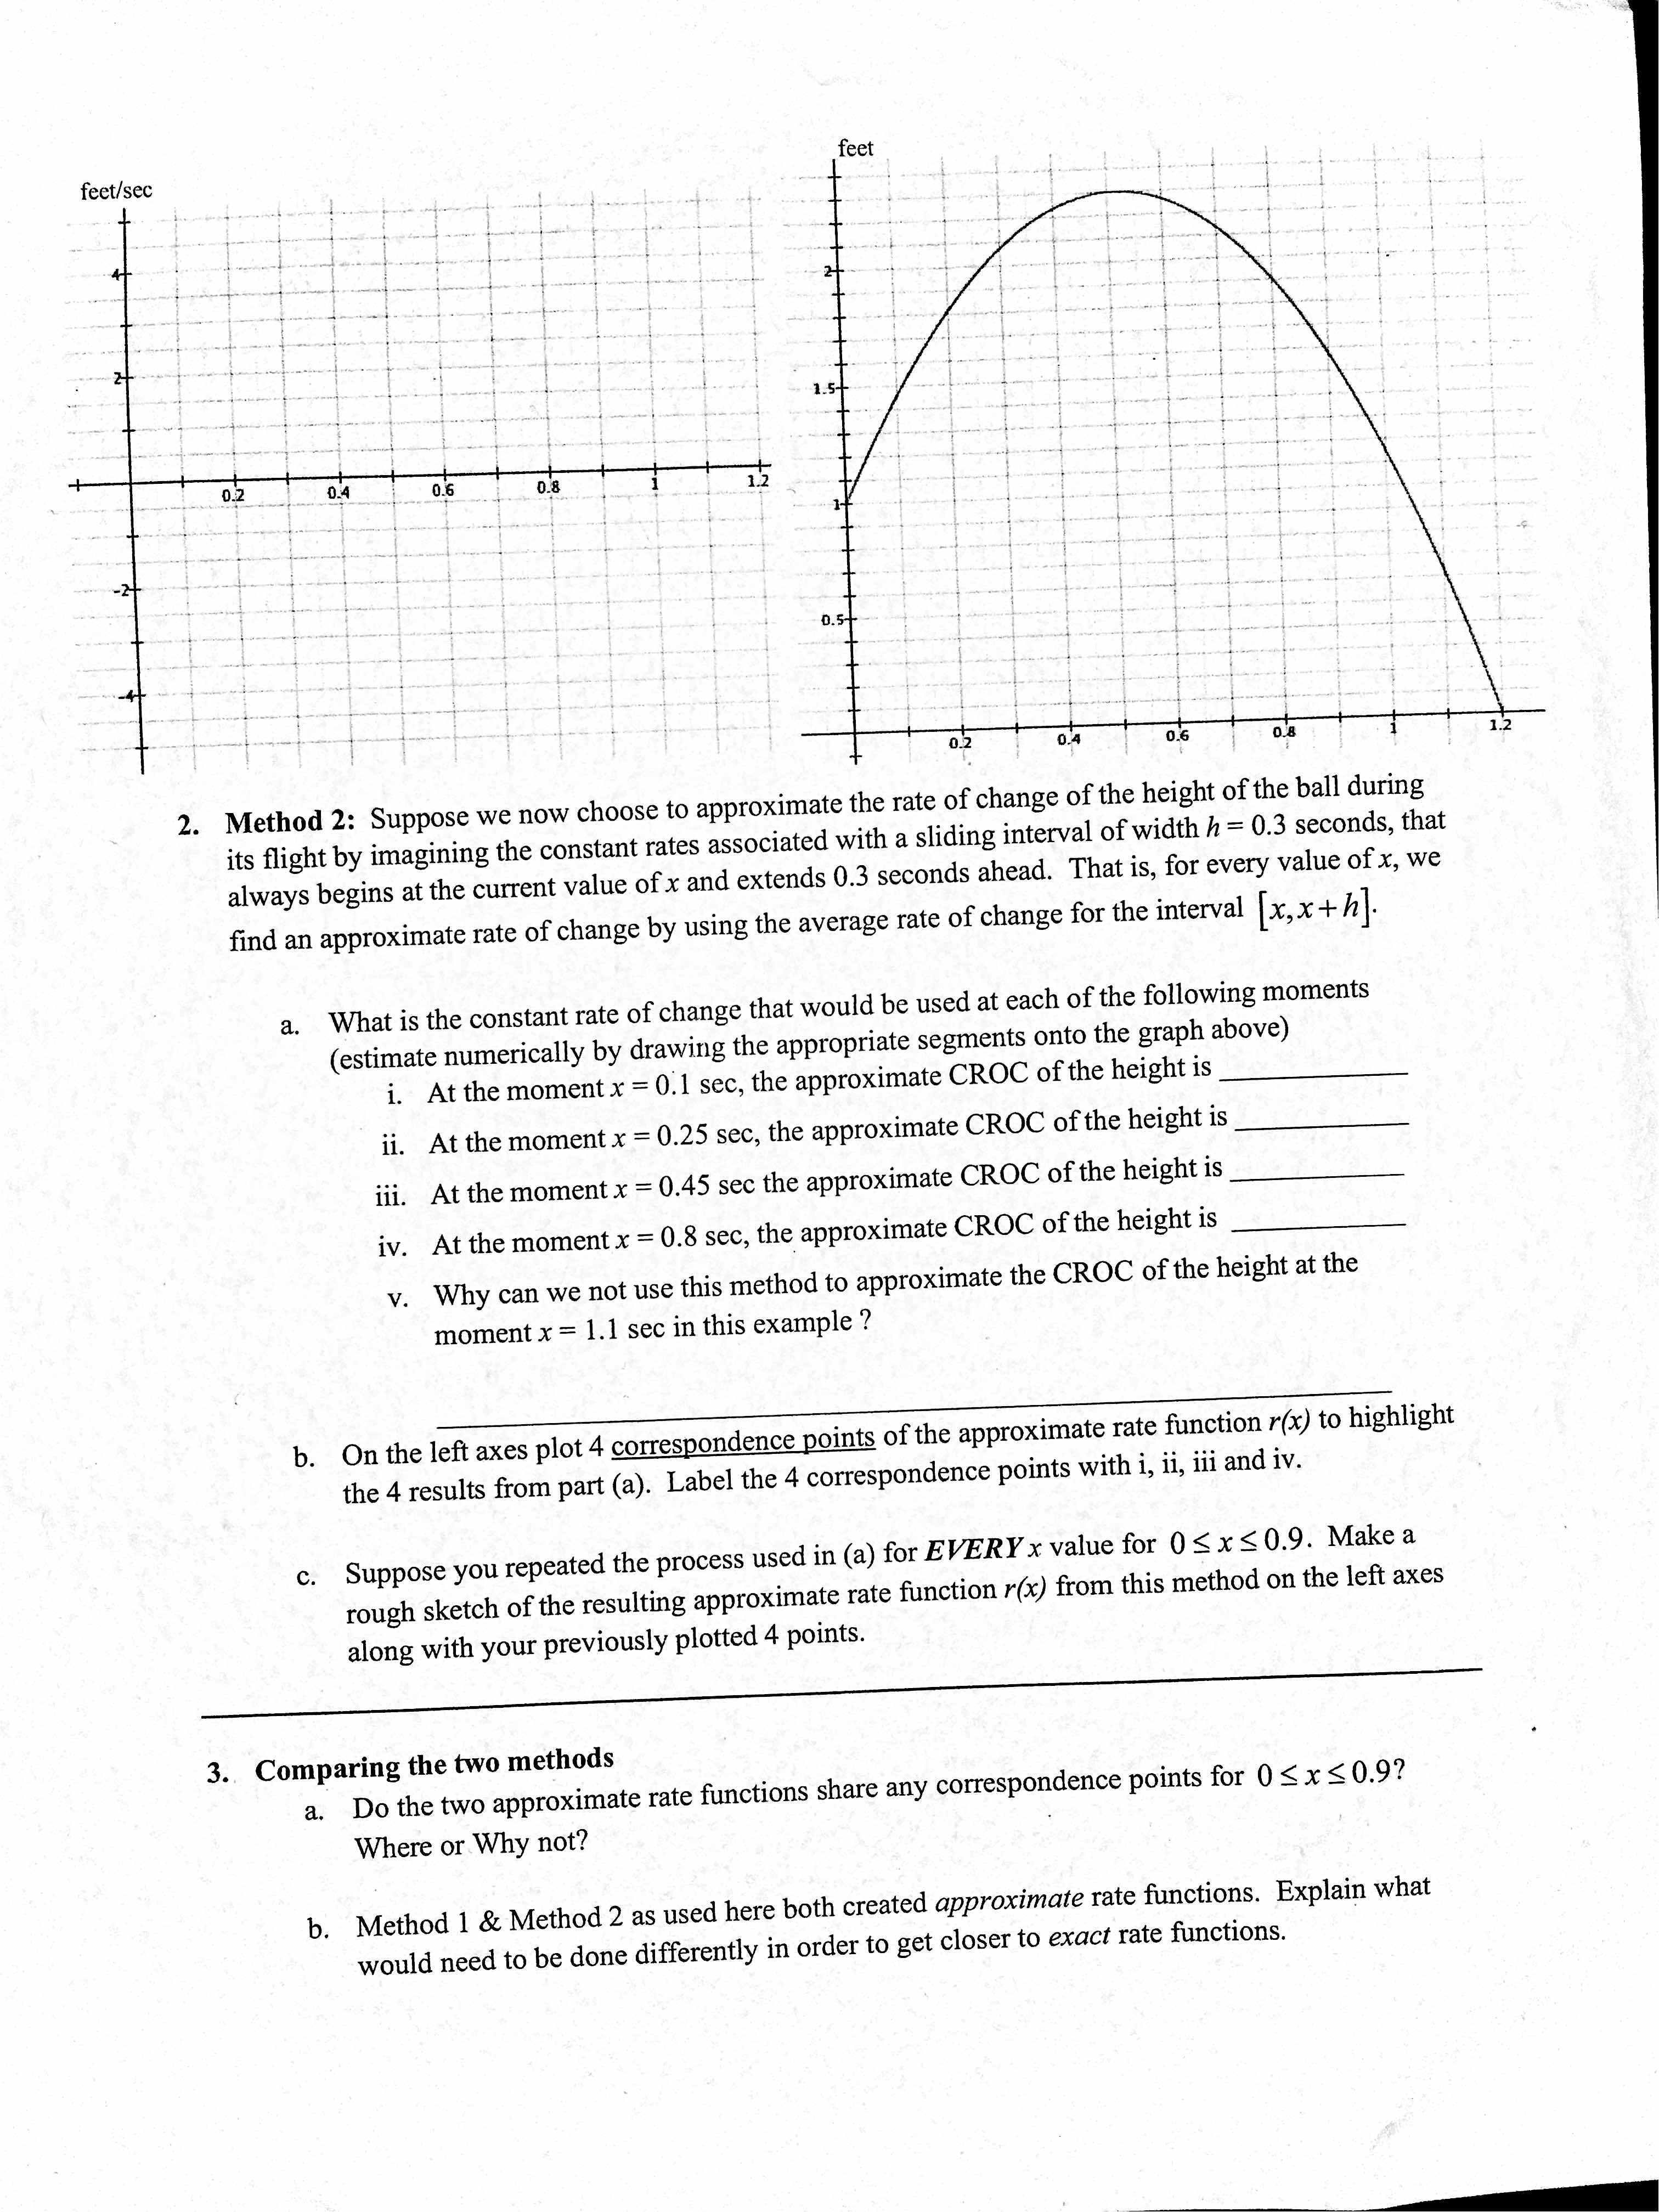
-_._ __ V___.V_DV 7 7,77,\"-7- ,,-,,_ Recitation day/time A ball is thrown upward, and its height is monitored as time goes by. Below at right is the graph of the ball's height in meters as a function of time since being thrown, in seconds. Our aim (2 methods) is to approximate the rate of change of the height of the ball during its ight. feet/sec 1. Method 1: Suppose that we rst aim to approximate the rate of change of the height of the ball during its ight by creating a piecewise linear approximate accumulation function using xed-position intervals of width Ax: 0.3 seconds. At interval boundaries (e. g., x = 0, 0.3, etc), the rate is found by looking ahead. That is, one constant rate is used for O S x
Step by Step Solution
There are 3 Steps involved in it

Get step-by-step solutions from verified subject matter experts