

Question: The above data (table) refers to the below questions: 1/ Create a pivot table and pie chart from the above data that show the distribution
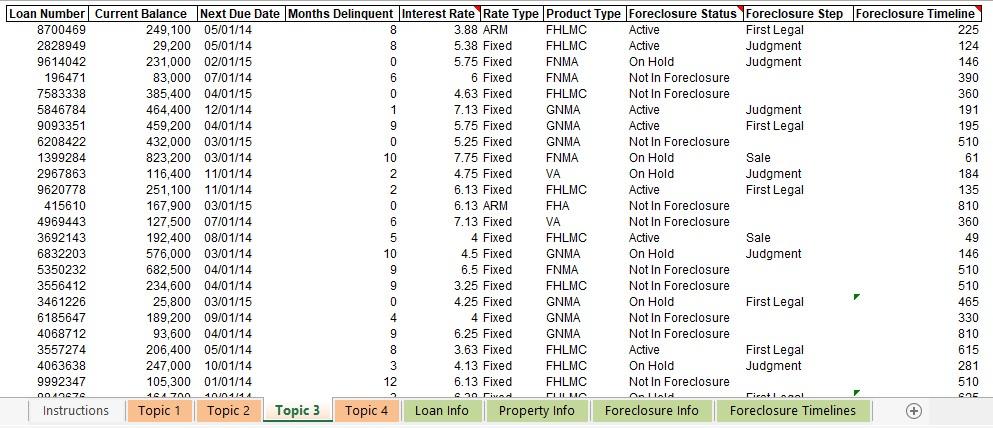
The above data (table) refers to the below questions:
1/ Create a pivot table and pie chart from the above data that show the distribution of product type by current balance (combine VA and USDA).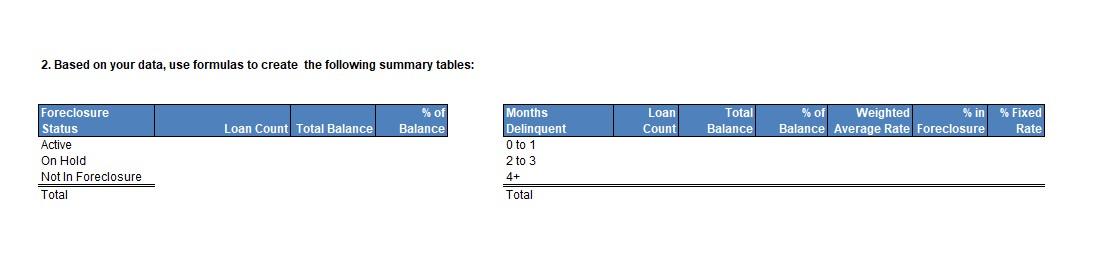
2. Based on your data, use formulas to create the following summary tables: 2. Based on your data, use formulas to create the following summary tables
Step by Step Solution
There are 3 Steps involved in it
1 Expert Approved Answer
Step: 1 Unlock

Question Has Been Solved by an Expert!
Get step-by-step solutions from verified subject matter experts
Step: 2 Unlock
Step: 3 Unlock