

Question: The following task will refer to the data you compiled in the previous tab. 1. Create a pivot table and pie chart that shows the
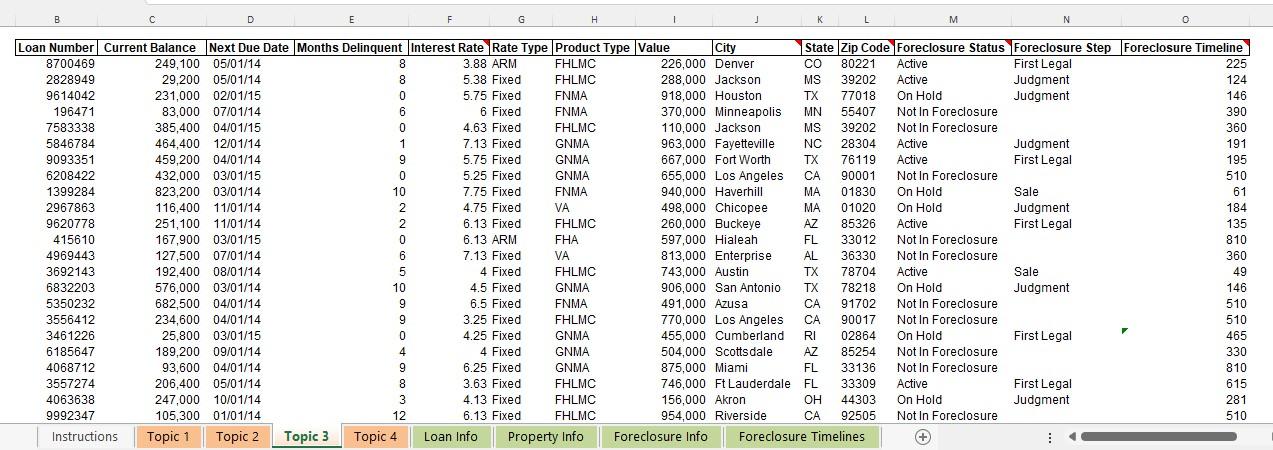
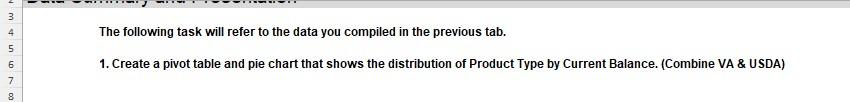
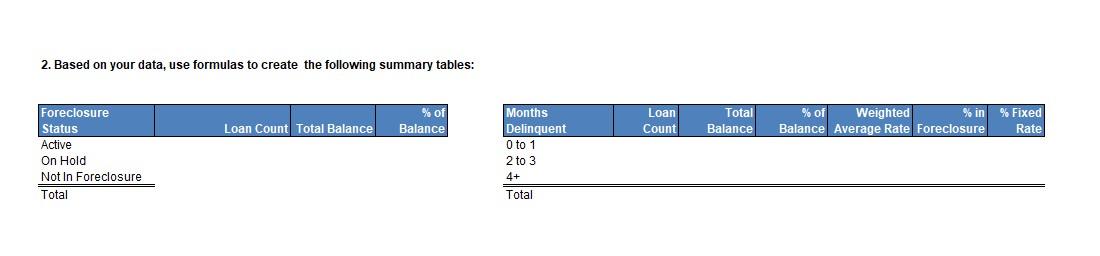
The following task will refer to the data you compiled in the previous tab. 1. Create a pivot table and pie chart that shows the distribution of Product Type by Current Balance. (Combine VA \& USDA) 2. Based on your data, use formulas to create the following summary tables: The following task will refer to the data you compiled in the previous tab. 1. Create a pivot table and pie chart that shows the distribution of Product Type by Current Balance. (Combine VA \& USDA) 2. Based on your data, use formulas to create the following summary tables
Step by Step Solution
There are 3 Steps involved in it
1 Expert Approved Answer
Step: 1 Unlock

Question Has Been Solved by an Expert!
Get step-by-step solutions from verified subject matter experts
Step: 2 Unlock
Step: 3 Unlock