

Question: The above scatter plot shows the yield vs years to maturity for 40 corporate bonds. a. What does the scatter chart indicate about the relationship
The above scatter plot shows the yield vs years to maturity for 40 corporate bonds.
a. What does the scatter chart indicate about the relationship between the two variables?
b. What is the correlation between yield and years?
c. What does the correlation coefficient indicate about the relation between yield and years?
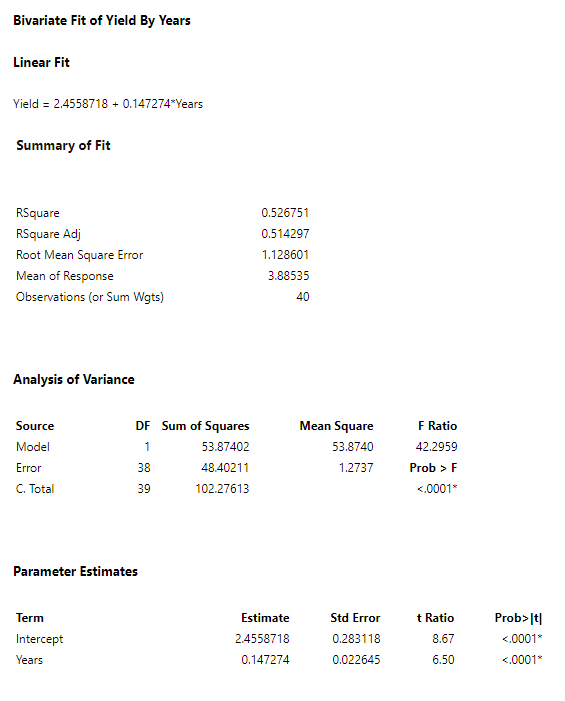
d. What is the estimated regression line from the data?
e. Use the estimated regression equation to predict the yield for a 10 year old company:
f. Is the overall regression relationship significant at a 0.05 level of significance? (Use the overall F-test)
g. Test the relationship between the independent variable and the dependent variable at a 0.05 level of significance. How would you interpret this model? (Use the individual t-test)
h. What other independent variables could you include in your regression model to explain more variation in yield?
Bivariate Fit of Yield By Years Linear Fit Yield = 2.4558718 +0.147274*Years Summary of Fit RSquare RSquare Adj Root Mean Square Error Mean of Response Observations (or Sum Wgts) 0.526751 0.514297 1.128601 3.88535 40 Analysis of Variance Source Model Error C. Total DF Sum of Squares 1 53.87402 38 48.40211 39 102.27613 Mean Square 53.8740 1.2737 F Ratio 42.2959 Prob > F <.0001 parameter estimates term estimate t ratio prob>It! <.0001 std error intercept years>Step by Step Solution
There are 3 Steps involved in it

Get step-by-step solutions from verified subject matter experts