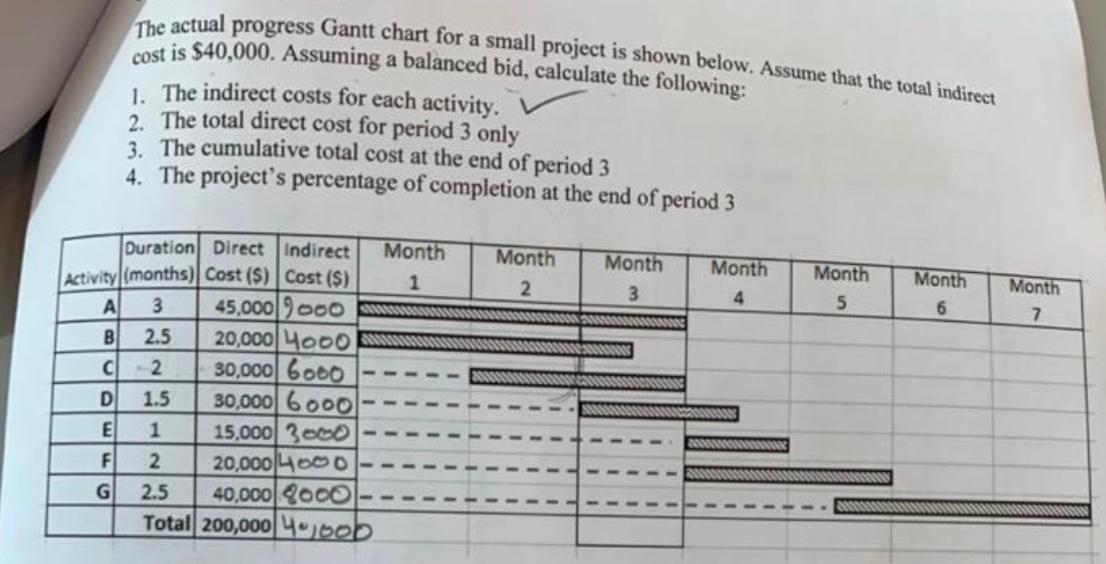
Question: The actual Gantt chart for a small project is shown below. Assume that the total indirect progress cost is $40,000. Assuming a balanced bid, calculate

The actual Gantt chart for a small project is

The actual Gantt chart for a small project is shown below. Assume that the total indirect progress cost is $40,000. Assuming a balanced bid, calculate the following: 1. The indirect costs for each activity. 2. The total direct cost for period 3 only 3. The cumulative total cost at the end of period 3 4. The project's percentage of completion at the end of period 3 Month Month 3 Month 2 Month 5 Month 6 Month 4 7 S Duration Direct Indirect Month Activity (months) Cost () Cost (S) 1 A 3 45,000 9000 B 2.5 20,000 4000 2 30,000 6000 D 1.5 30,000 6000 E 1 15,000 3000 F 2 20,000 400 G 2.5 40,000 8000 Total 200,000 40 bob

Step by Step Solution

There are 3 Steps involved in it

1 Expert Approved Answer
Step: 1 Unlock blur-text-image
Question Has Been Solved by an Expert!

Get step-by-step solutions from verified subject matter experts

Step: 2 Unlock
Step: 3 Unlock

Students Have Also Explored These Related General Management Questions!