

Question: The axis for both plots should be O2/CH4 vs CO/CO2 (Question 1) CH4+1.502=CO+2H20 CO+0.502=CO2 Use mole balance/equilibrium conversion to determine how the equilibrium co/CO2 ratio
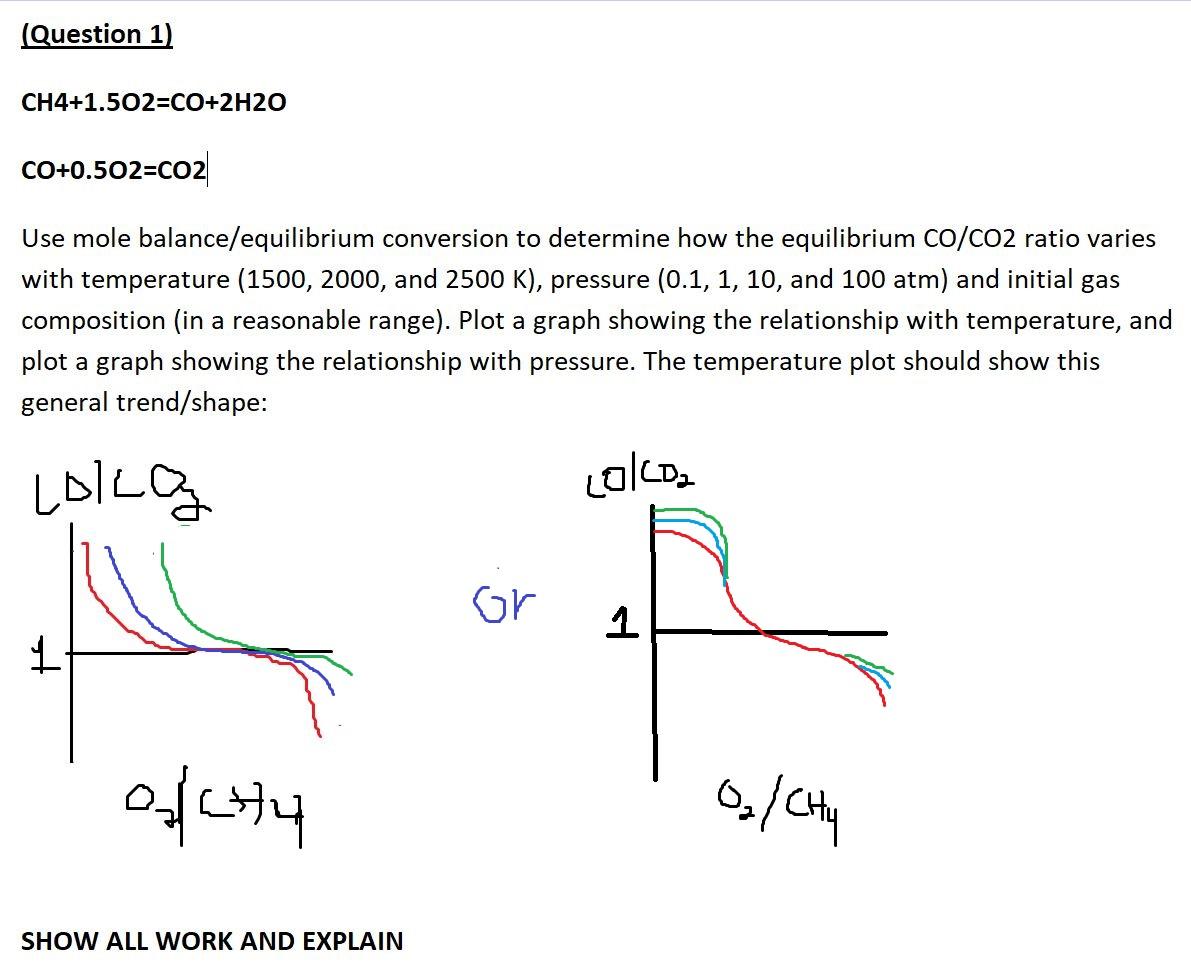 The axis for both plots should be O2/CH4 vs CO/CO2
(Question 1) CH4+1.502=CO+2H20 CO+0.502=CO2 Use mole balance/equilibrium conversion to determine how the equilibrium co/CO2 ratio varies with temperature (1500, 2000, and 2500 K), pressure (0.1, 1, 10, and 100 atm) and initial gas composition (in a reasonable range). Plot a graph showing the relationship with temperature, and plot a graph showing the relationship with pressure. The temperature plot should show this general trend/shape: Lolla Lolcoa Gr 1 ochy 0/0 SHOW ALL WORK AND EXPLAIN
Step by Step Solution
There are 3 Steps involved in it
1 Expert Approved Answer
Step: 1 Unlock

Question Has Been Solved by an Expert!
Get step-by-step solutions from verified subject matter experts
Step: 2 Unlock
Step: 3 Unlock