

Question: The bathtub curve, which is a model for system reliability including early life burn-in and eventual wear-out at the systems end of life. For software
The bathtub curve, which is a model for system reliability including early life burn-in and eventual wear-out at the systems end of life. For software systems, the reliability remains nearly constant with no wear-out other than associated hardware.
Let's take a closer look at the early life period of a system. Almost all reliability diagrams use some sort of exponential distribution to depict the early-life stages of a system. But is that always the case?
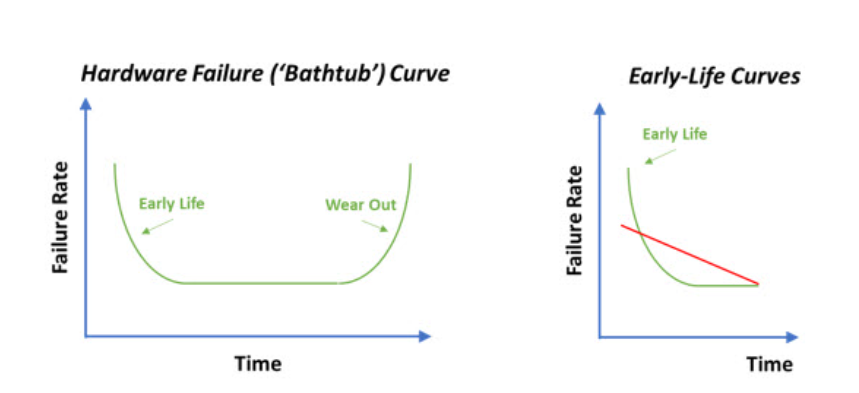
What types of distributions do you expect at the early-life part of the curb? For instance, is a linear (red line) reduction in failure rate common for specific products/processes/systems? What is the most favorable in your opinion?
Hardware Failure ('Bathtub') Curve Early-Life Curves Early Life Early Life Wear Out Failure Rate Failure Rate Time TimeStep by Step Solution
There are 3 Steps involved in it

Get step-by-step solutions from verified subject matter experts