

Question: The below figure is a value stream map of a fabrication process, with an average daily demand of 450 units per day. The workday
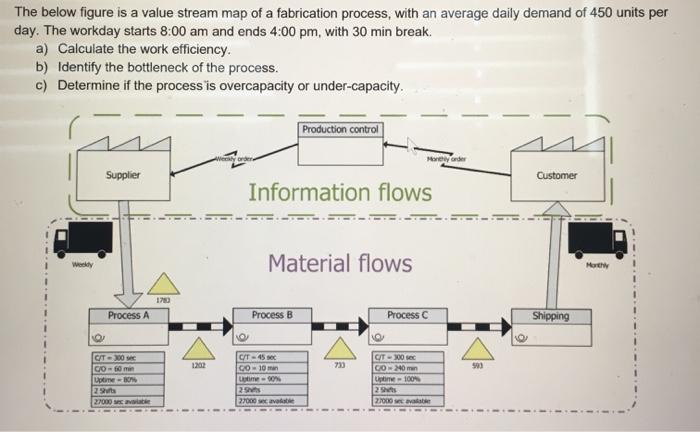
The below figure is a value stream map of a fabrication process, with an average daily demand of 450 units per day. The workday starts 8:00 am and ends 4:00 pm, with 30 min break. a) Calculate the work efficiency. b) Identify the bottleneck of the process. c) Determine if the process is overcapacity or under-capacity. Weekdy Supplier Process A C/T-300 sec CO-60 min Uptime-80% 2 Shifts 27000 sec avariable 1783 1202 Weekly Information flows Material flows Process B Production control C/T-45 sec CO-10 min Lptime-90% 2 Shits 27000 sec avalable 733 Monthly order Process C C/T-300 sec CO-240 min Uptime-100% 2 Shots 27000 sec avalable 593 Customer Shipping Monthly
Step by Step Solution
3.37 Rating (169 Votes )
There are 3 Steps involved in it
a Work Efficiency Work efficiency can be calculated by dividing the total available time by the total time required for production In this case the av... View full answer

Get step-by-step solutions from verified subject matter experts