

Question: The below figure is a value stream map of a fabrication process, with an average daily demand of 450 units per day. The workday starts
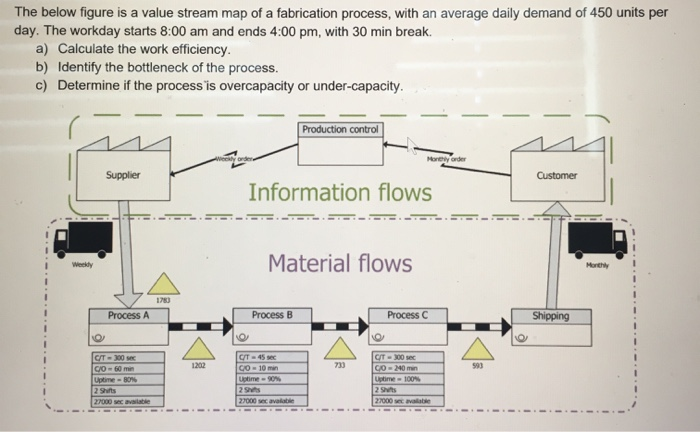
The below figure is a value stream map of a fabrication process, with an average daily demand of 450 units per day. The workday starts 8:00 am and ends 4:00 pm, with 30 min break. a) Calculate the work efficiency. b) Identify the bottleneck of the process. C) Determine if the process is overcapacity or under-capacity Production control Supplier Customer Information flows -.-.-.-. -.-.-.-.-.-.-.-.-.- Material flows Process A Process B Process C Shipping CT-300 CO 60 min 2 Suits D ate 27000 cavabile The below figure is a value stream map of a fabrication process, with an average daily demand of 450 units per day. The workday starts 8:00 am and ends 4:00 pm, with 30 min break. a) Calculate the work efficiency. b) Identify the bottleneck of the process. C) Determine if the process is overcapacity or under-capacity Production control Supplier Customer Information flows -.-.-.-. -.-.-.-.-.-.-.-.-.- Material flows Process A Process B Process C Shipping CT-300 CO 60 min 2 Suits D ate 27000 cavabile
Step by Step Solution
There are 3 Steps involved in it

Get step-by-step solutions from verified subject matter experts