

Question: The bisection method Fig. l shows the graphical representation of a continuous function y = f(x). It can be seen that the roots of the
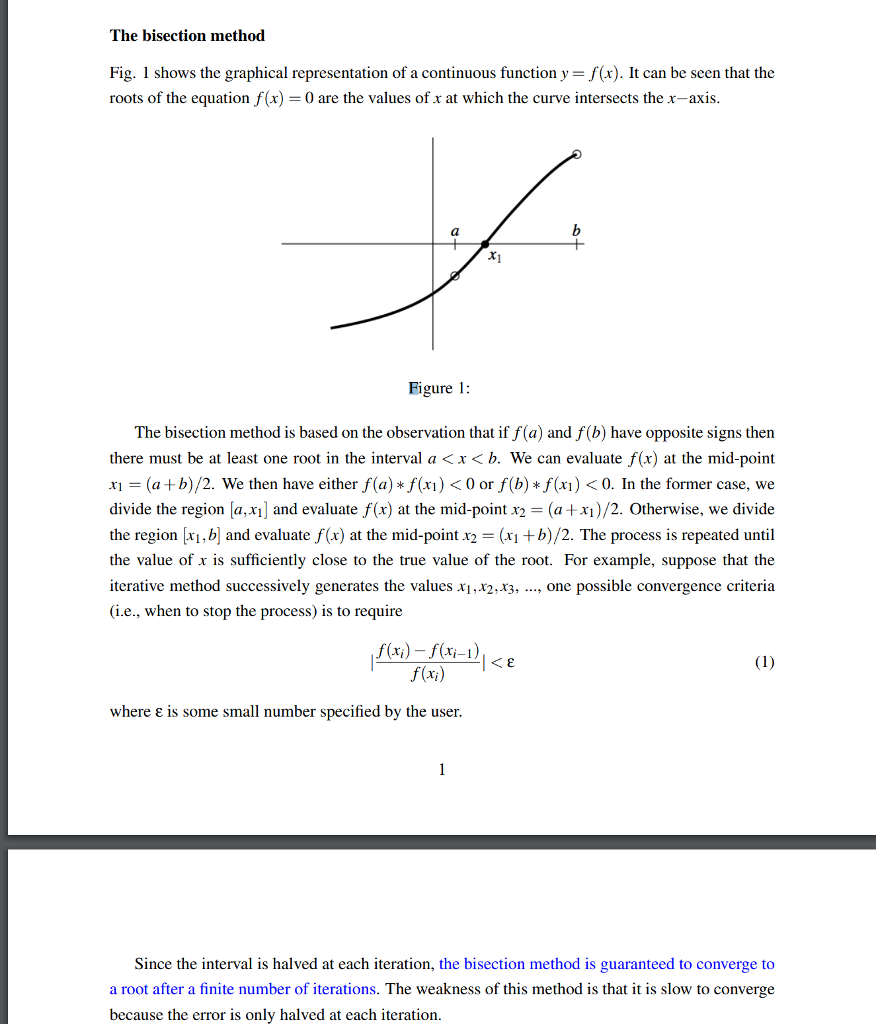
The bisection method Fig. l shows the graphical representation of a continuous function y = f(x). It can be seen that the roots of the equation f(x)0 are the values of x at which the curve intersects the x-axis ri Figure 1 The bisection method is based on the observation that if f(a) and f(b) have opposite signs then there must be at least one root in the interval a
Step by Step Solution
There are 3 Steps involved in it
1 Expert Approved Answer
Step: 1 Unlock

Question Has Been Solved by an Expert!
Get step-by-step solutions from verified subject matter experts
Step: 2 Unlock
Step: 3 Unlock