

Question: The block diagram for a process with feedback control for output deviation variable h is shown in the figure below. All transfer functions are given
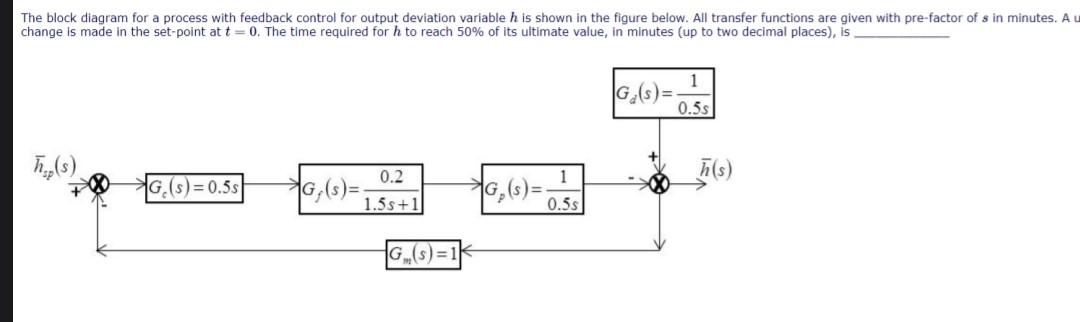
The block diagram for a process with feedback control for output deviation variable h is shown in the figure below. All transfer functions are given with ore-factor of s in minutes. A change is made in the set-point at t=0. The time required for h to reach 50% of its ultimate value, in minutes (up to two decimal places), is The block diagram for a process with feedback control for output deviation variable h is shown in the figure below. All transfer functions are given with ore-factor of s in minutes. A change is made in the set-point at t=0. The time required for h to reach 50% of its ultimate value, in minutes (up to two decimal places), is
Step by Step Solution
There are 3 Steps involved in it

Get step-by-step solutions from verified subject matter experts