

Question: The Box - and - Whisker plot and histogram with the normal curve are given. Select all the true statements Select one or more: For
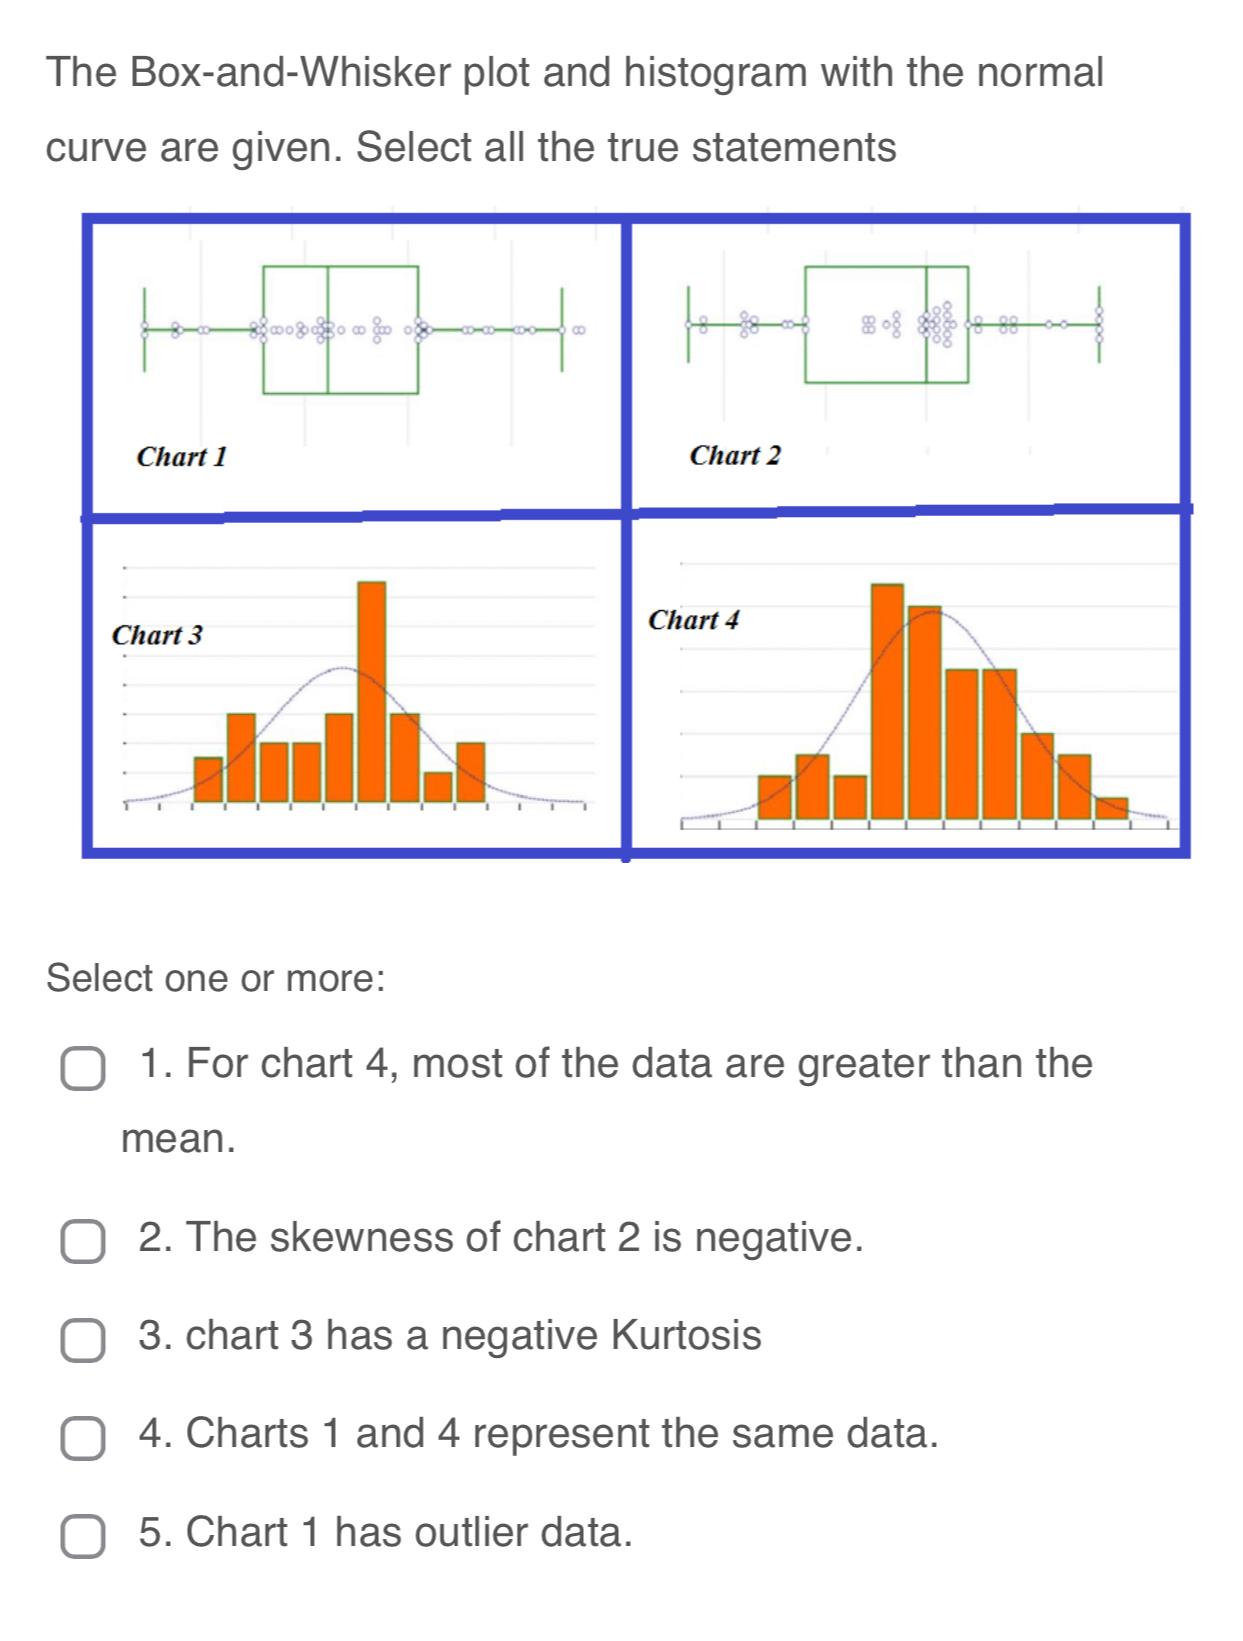
The BoxandWhisker plot and histogram with the normal curve are given. Select all the true statements
Select one or more:
For chart most of the data are greater than the mean.
The skewness of chart is negative.
chart has a negative Kurtosis
Charts and represent the same data.
Chart has outlier data.
Step by Step Solution
There are 3 Steps involved in it
1 Expert Approved Answer
Step: 1 Unlock

Question Has Been Solved by an Expert!
Get step-by-step solutions from verified subject matter experts
Step: 2 Unlock
Step: 3 Unlock