

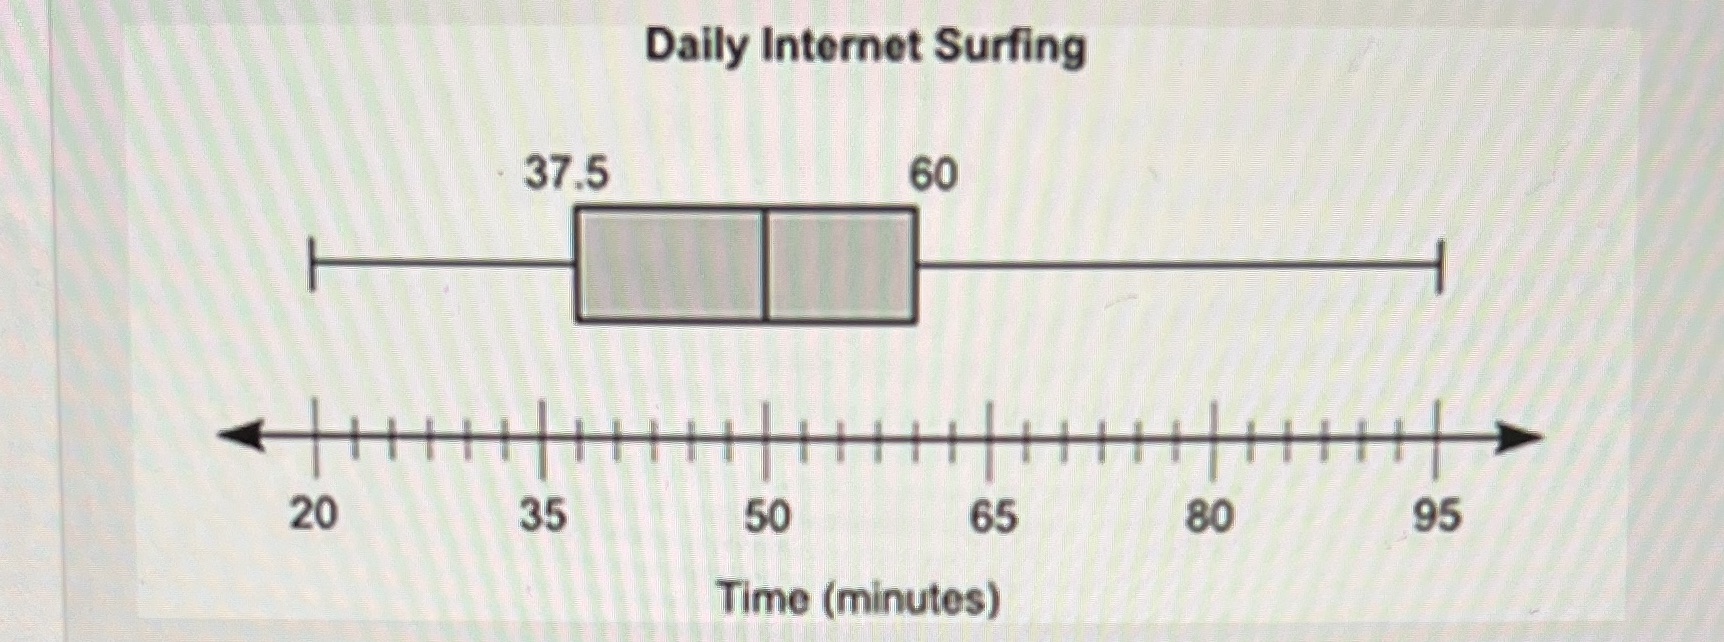
Question: The box plot below shows the total amount of time, in minutes, the students of a class surf the Internet every day: Part A: List
The box plot below shows the total amount of time, in minutes, the students of a class surf the Internet every day: Part A: List two pieces of information that are provided by the graph and one piece of information that is not provided by the graph. Part B: Calculate the interquartile range of the data, and explain in a sentence or two what it represents. Part C: Explain what affect, if any, there will be if an outlier is present.
 \f
\f
Step by Step Solution
There are 3 Steps involved in it
1 Expert Approved Answer
Step: 1 Unlock

Question Has Been Solved by an Expert!
Get step-by-step solutions from verified subject matter experts
Step: 2 Unlock
Step: 3 Unlock