

Question: The chart below shows the box plot of the age of some of the participants in the Framingham study by gender. Calculate and report
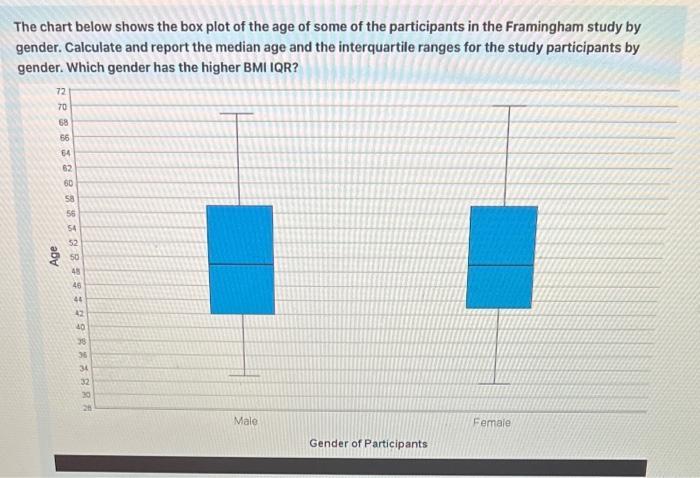
The chart below shows the box plot of the age of some of the participants in the Framingham study by gender. Calculate and report the median age and the interquartile ranges for the study participants by gender. Which gender has the higher BMI IQR? 72 PPSS 70 68 Age 66 64 88832 62 60 58 56 54 222232REARRA 48 46 42 40 34 30 Male Gender of Participants Female
Step by Step Solution
★★★★★
3.46 Rating (153 Votes )
There are 3 Steps involved in it
1 Expert Approved Answer
Step: 1 Unlock

Given the box plot of the age of some of the participants in the Framingham study by gender A... View full answer
Question Has Been Solved by an Expert!
Get step-by-step solutions from verified subject matter experts
Step: 2 Unlock
Step: 3 Unlock