

Figure18 . 25 shows the series of Walmart daily closing prices between February 2001 and February 2002
Question:
Figure18 . 25 shows the series of Walmart daily closing prices between February 2001 and February 2002 (thanks to Chris Albright for suggesting the use of these data, which are publicly available, for example, at http://finance. yahoo.com and are in the file WalMartStock.csv).
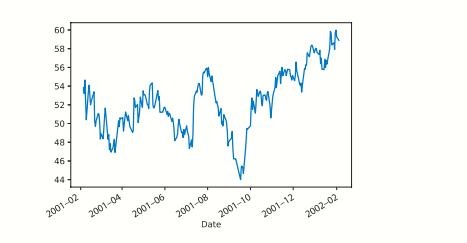
a. Create a well-formatted time plot of the closing price series.
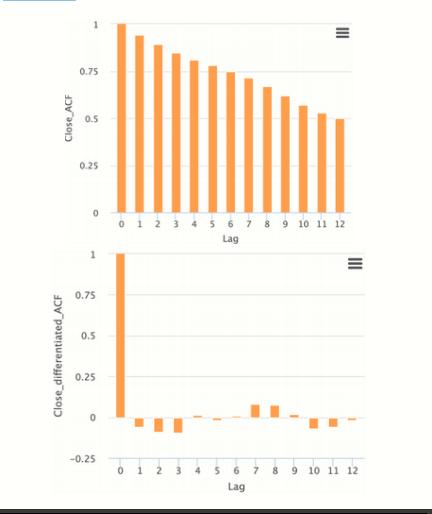
b. Compute a lag-1 differenced series of the closing prices. Create a time plot of the differenced series. Note your observations by visually inspecting the differenced series.
c. Which of the following is/are relevant for testing whether this stock is a random walk?
• The autocorrelations of the close prices series • The autocorrelations of the lag-1 differenced close prices series • The AR(1) constant coefficient
d. Use the relevant information from Figure 18 .26 to decide whether this is a random walk. Explain how you reached your conclusion and based on which statistics and/or plots.
e. What are the implications of finding that a time series is a random walk? Choose the correct statement(s) below.
• It is impossible to obtain forecasts that are more accurate than naive forecasts for the series.
• The series is random.
• The changes in the series from one period to the next are random
Step by Step Answer:

This question has not been answered yet.
You can Ask your question!


Machine Learning For Business Analytics
ISBN: 9781119828792
1st Edition
Authors: Galit Shmueli, Peter C. Bruce, Amit V. Deokar, Nitin R. Patel
