

Question: the code please In this homework, you are required to use MATLAB to filter a signal of a finite duration, both in the time domain
 the code please
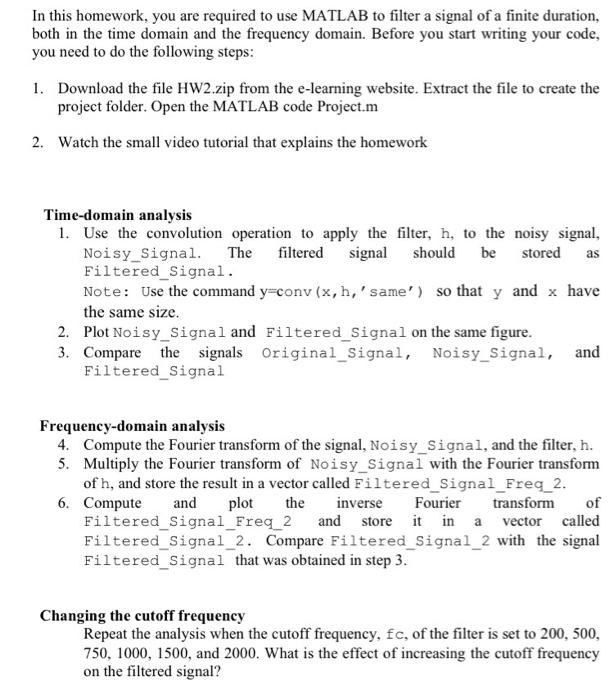
In this homework, you are required to use MATLAB to filter a signal of a finite duration, both in the time domain and the frequency domain. Before you start writing your code, you need to do the following steps: 1. Download the file HW2.zip from the e-learning website. Extract the file to create the project folder. Open the MATLAB code Project.m 2. Watch the small video tutorial that explains the homework as Time-domain analysis 1. Use the convolution operation to apply the filter, h, to the noisy signal, Noisy Signal The filtered signal should be stored Filtered_Signal. Note: Use the command y=conv(x, h,'same') so that y and x have the same size. 2. Plot Noisy Signal and Filtered Signal on the same figure. 3. Compare the signals Original_Signal, Noisy_Signal, and Filtered_Signal Frequency-domain analysis 4. Compute the Fourier transform of the signal, Noisy_Signal, and the filter, h. 5. Multiply the Fourier transform of Noisy Signal with the Fourier transform of h, and store the result in a vector called Filtered_Signal_Freq_2. 6. Compute and plot the inverse Fourier transform of Filtered_Signal Freq_2 and store it in a vector called Filtered_Signal_2. Compare Filtered_Signal_2 with the signal Filtered_Signal that was obtained in step 3. Changing the cutoff frequency Repeat the analysis when the cutoff frequency, fc, of the filter is set to 200, 500, 750, 1000, 1500, and 2000. What is the effect of increasing the cutoff frequency on the filtered signal? In this homework, you are required to use MATLAB to filter a signal of a finite duration, both in the time domain and the frequency domain. Before you start writing your code, you need to do the following steps: 1. Download the file HW2.zip from the e-learning website. Extract the file to create the project folder. Open the MATLAB code Project.m 2. Watch the small video tutorial that explains the homework as Time-domain analysis 1. Use the convolution operation to apply the filter, h, to the noisy signal, Noisy Signal The filtered signal should be stored Filtered_Signal. Note: Use the command y=conv(x, h,'same') so that y and x have the same size. 2. Plot Noisy Signal and Filtered Signal on the same figure. 3. Compare the signals Original_Signal, Noisy_Signal, and Filtered_Signal Frequency-domain analysis 4. Compute the Fourier transform of the signal, Noisy_Signal, and the filter, h. 5. Multiply the Fourier transform of Noisy Signal with the Fourier transform of h, and store the result in a vector called Filtered_Signal_Freq_2. 6. Compute and plot the inverse Fourier transform of Filtered_Signal Freq_2 and store it in a vector called Filtered_Signal_2. Compare Filtered_Signal_2 with the signal Filtered_Signal that was obtained in step 3. Changing the cutoff frequency Repeat the analysis when the cutoff frequency, fc, of the filter is set to 200, 500, 750, 1000, 1500, and 2000. What is the effect of increasing the cutoff frequency on the filtered signal
Step by Step Solution
There are 3 Steps involved in it

Get step-by-step solutions from verified subject matter experts