

Question: The continuous variable I have chosen is temperature, as seen on the right-hand side.I would prefer if the work was written on paper :) weather
The continuous variable I have chosen is temperature, as seen on the right-hand side.I would prefer if the work was written on paper :)
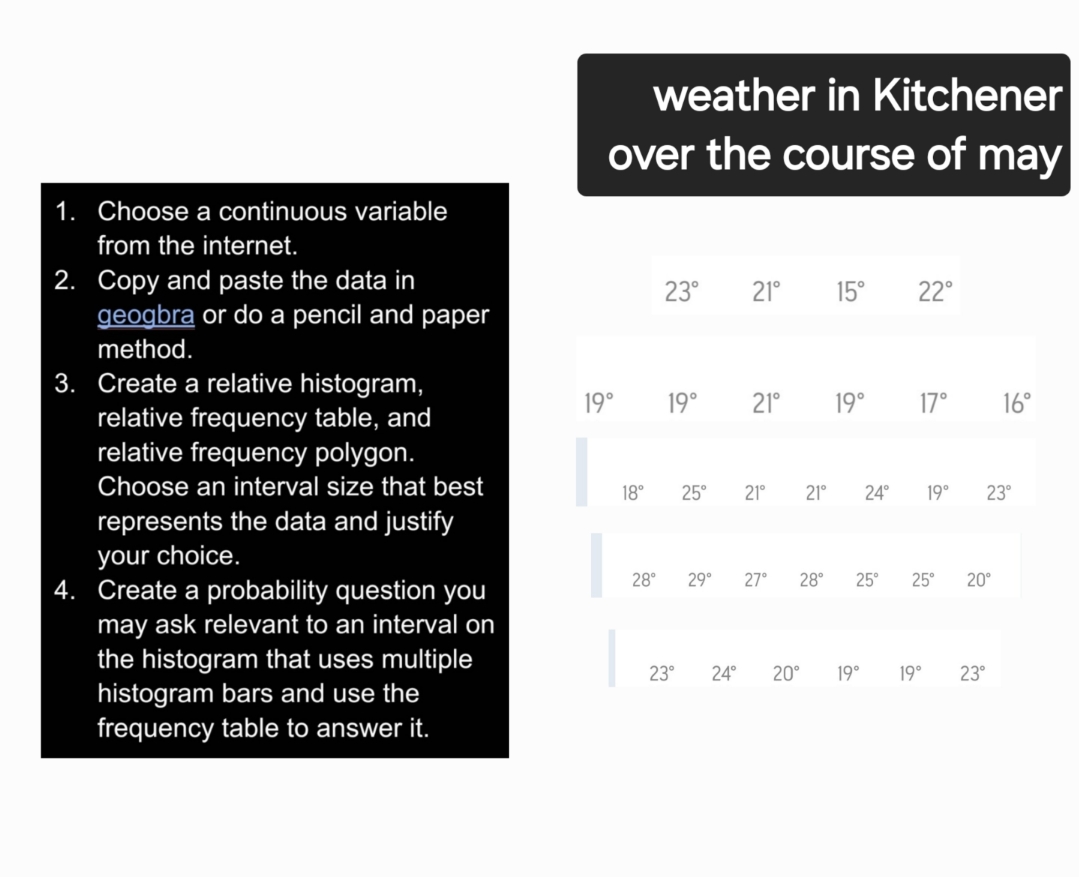
weather in Kitchener over the course of may 1. Choose a continuous variable from the internet. 2. Copy and paste the data in 230 210 150 22 geogbra or do a pencil and paper method. 3. Create a relative histogram, 190 relative frequency table, and 190 210 190 17 16 relative frequency polygon. Choose an interval size that best 180 250 210 210 240 190 23 represents the data and justify your choice. 4. Create a probability question you 28 290 27 25 25 20 may ask relevant to an interval on the histogram that uses multiple 23 240 20 190 190 230 histogram bars and use the frequency table to answer it
Step by Step Solution
There are 3 Steps involved in it

Get step-by-step solutions from verified subject matter experts