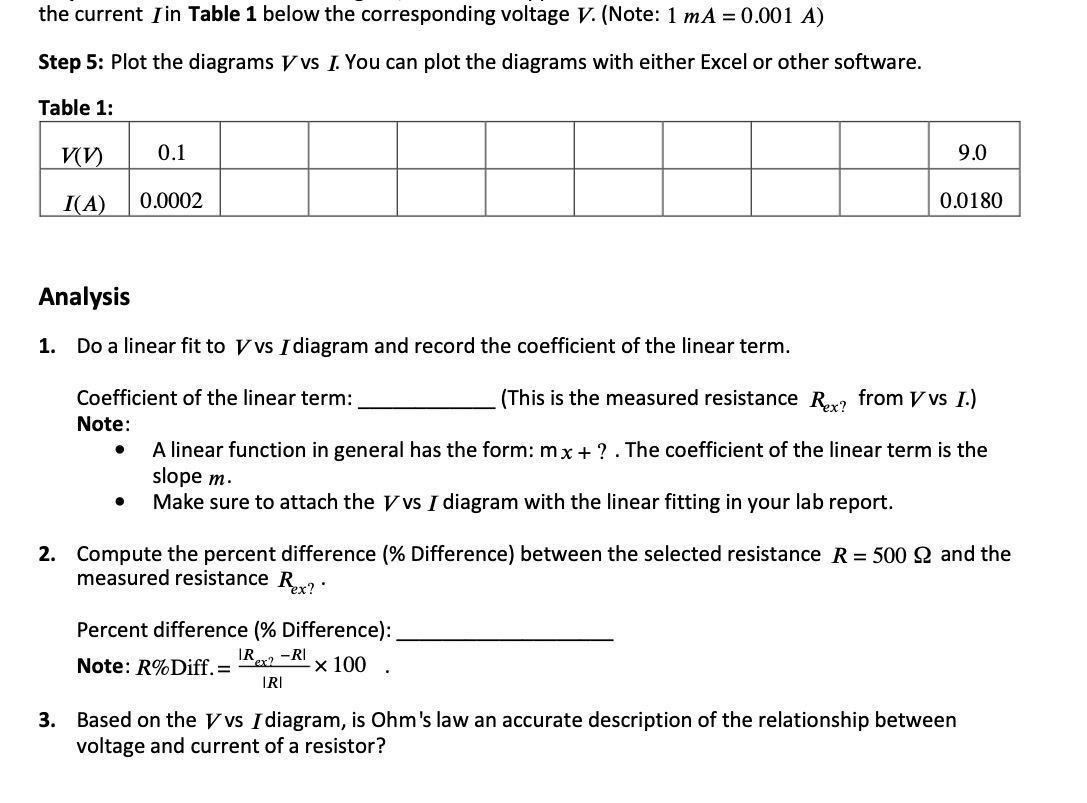
Question: the current / in Table 1 below the corresponding voltage V. (Note: 1 mA = 0.001 A) Step 5: Plot the diagrams Vvs J. You

the current / in Table 1 below the corresponding
the current / in Table 1 below the corresponding voltage V. (Note: 1 mA = 0.001 A) Step 5: Plot the diagrams Vvs J. You can plot the diagrams with either Excel or other software. Table 1: V(V) 0.1 9.0 I(A) 0.0002 0.0180 Analysis 1. Do a linear fit to Vvs / diagram and record the coefficient of the linear term. Coefficient of the linear term: (This is the measured resistance Rex, from Vvs I.) Note: A linear function in general has the form: mx + ? . The coefficient of the linear term is the slope m. Make sure to attach the Vvs / diagram with the linear fitting in your lab report. 2. Compute the percent difference (% Difference) between the selected resistance R = 500 2 and the measured resistance Rex? Percent difference (% Difference): Note: R%Diff. = Rex? -RI " X 100 IRI 3. Based on the Vvs I diagram, is Ohm's law an accurate description of the relationship between voltage and current of a resistor

Step by Step Solution

There are 3 Steps involved in it

1 Expert Approved Answer
Step: 1 Unlock blur-text-image
Question Has Been Solved by an Expert!

Get step-by-step solutions from verified subject matter experts

Step: 2 Unlock
Step: 3 Unlock

Students Have Also Explored These Related Mathematics Questions!