

Question: The data given to the right includes data from 42 candies, and 9 of them Weights (g) of a Sample Bag of Candy are red.
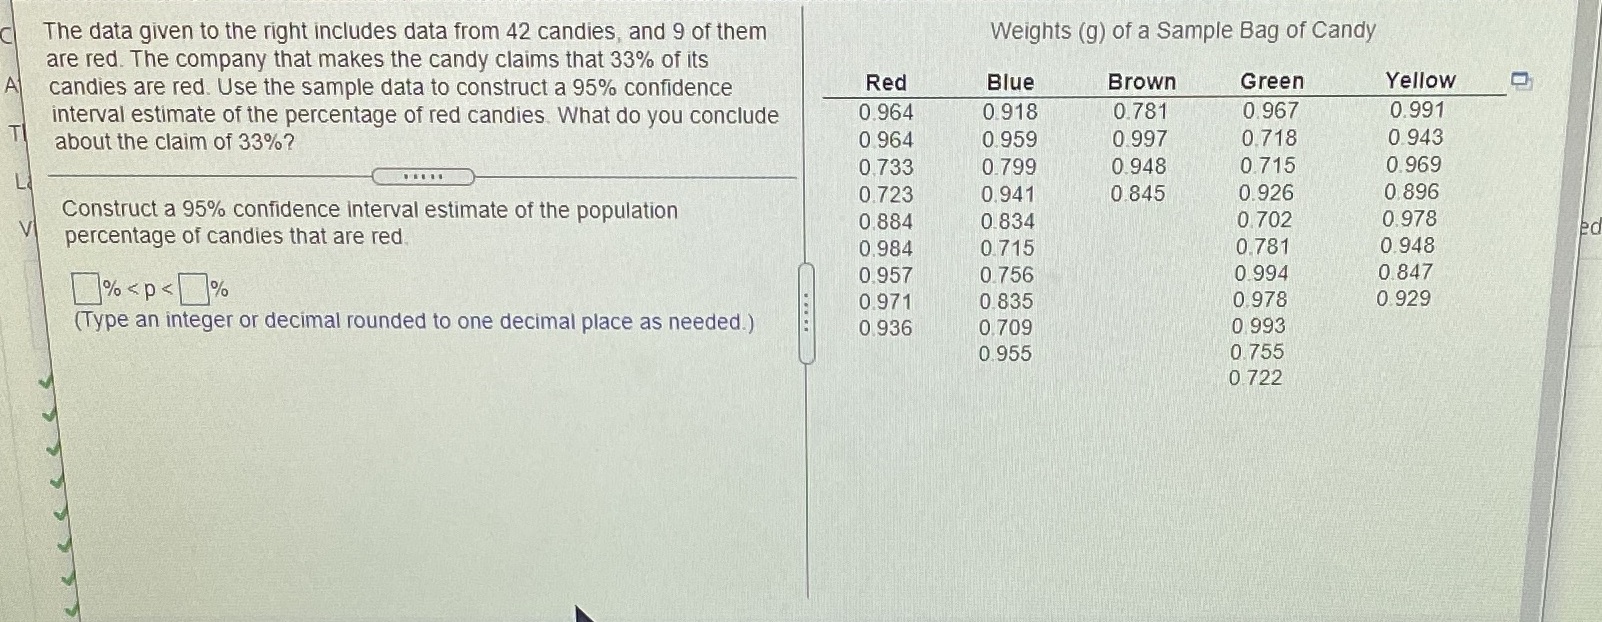
The data given to the right includes data from 42 candies, and 9 of them Weights (g) of a Sample Bag of Candy are red. The company that makes the candy claims that 33% of its A1 candies are red. Use the sample data to construct a 95% confidence Red Blue Brown Green Yellow interval estimate of the percentage of red candies. What do you conclude 0.964 0.918 0.781 0.967 0.991 about the claim of 33%? 0.964 0.959 0.997 0.718 0.943 0,733 0.799 0.948 0.715 0.969 Construct a 95% confidence interval estimate of the population 0.723 0.941 0.845 0.926 0.896 percentage of candies that are red, 0.884 0.834 0.702 0.978 0.984 0.715 0.781 0.948 %
Step by Step Solution
There are 3 Steps involved in it
1 Expert Approved Answer
Step: 1 Unlock

Question Has Been Solved by an Expert!
Get step-by-step solutions from verified subject matter experts
Step: 2 Unlock
Step: 3 Unlock