

Question: The data has been collected in the Microsoft Excel file below. Download the spreadsheet and perform the required analysis to answer the questions below. Download
The data has been collected in the Microsoft Excel file below. Download the spreadsheet and perform the required analysis to answer the questions below.
Download spreadsheet SmartSpeakerexIsx
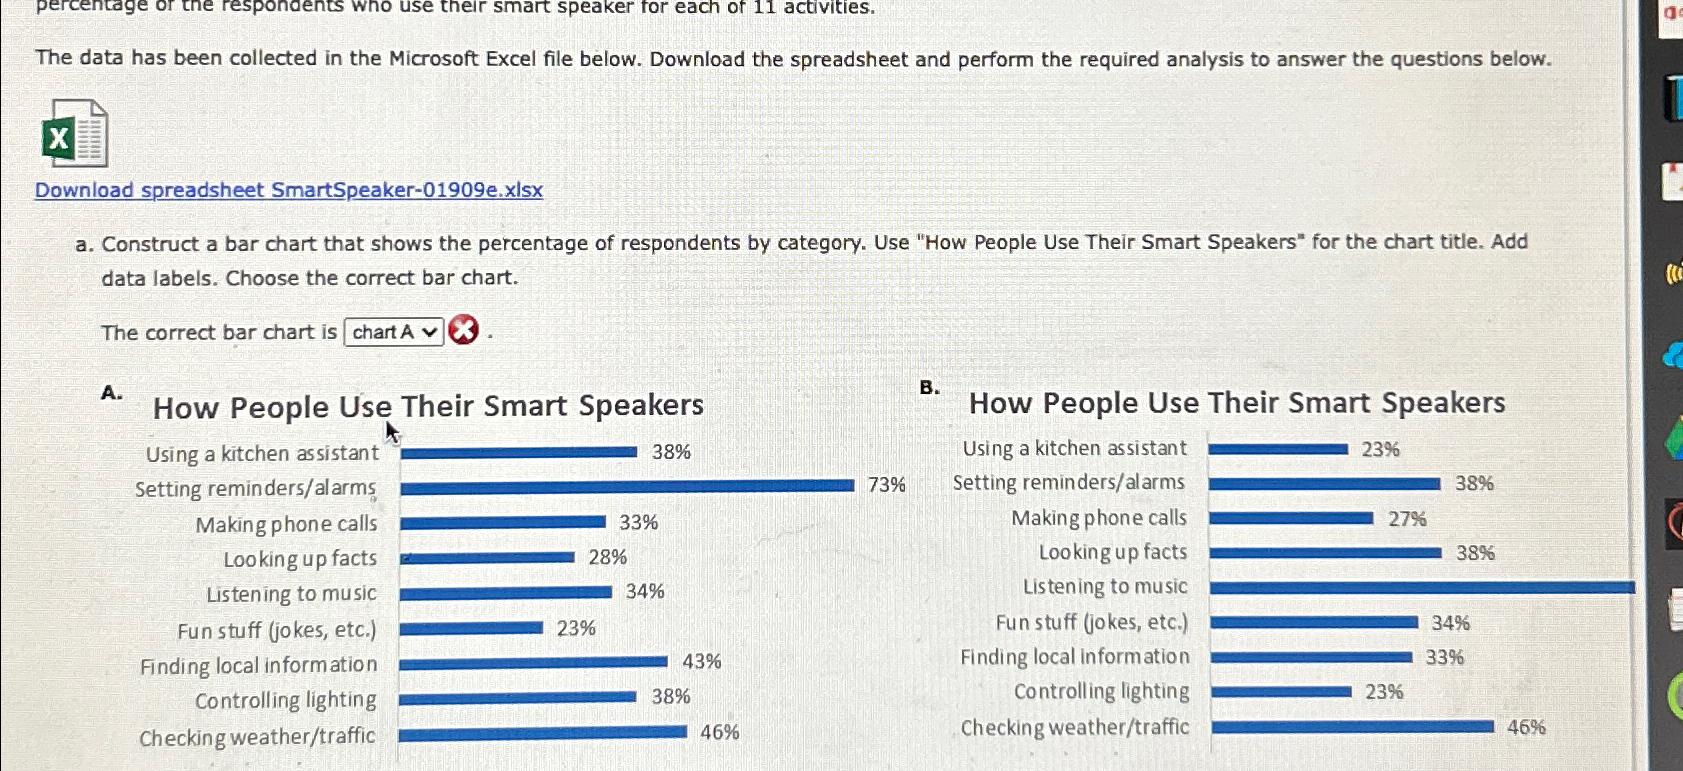
a Construct a bar chart that shows the percentage of respondents by category. Use "How People Use Their Smart Speakers" for the chart title. Add data labels. Choose the correct bar chart.
The correct bar chart is
A How People Use Their Smart Speakers
B How People Use Their Smart Speakers Using a kitchen assistant Setting remindersalarms
Step by Step Solution
There are 3 Steps involved in it
1 Expert Approved Answer
Step: 1 Unlock

Question Has Been Solved by an Expert!
Get step-by-step solutions from verified subject matter experts
Step: 2 Unlock
Step: 3 Unlock