

Question: The data in Table 25 represents the sales for each quarter during four different years, Compute seasonal indices and find the reseasonalized forecast by applying
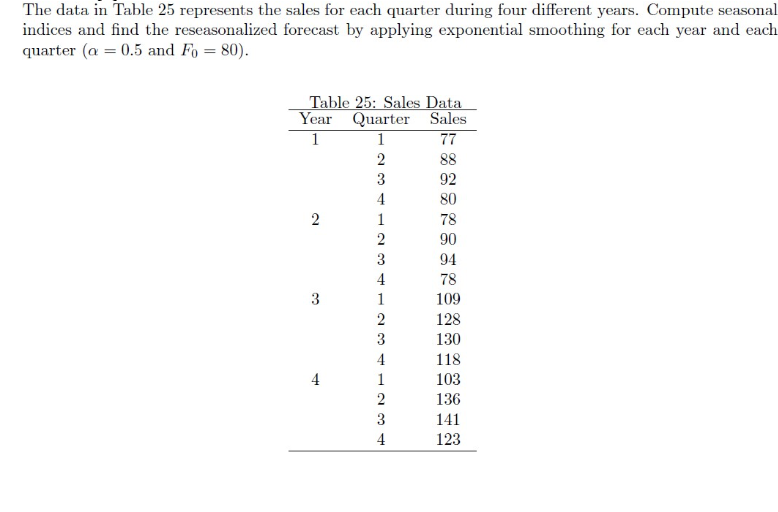 The data in Table 25 represents the sales for each quarter during four different years, Compute seasonal indices and find the reseasonalized forecast by applying exponential smoothing for each year and each quarter (a=0.5 and Fo = 80). 1 Table 25: Sales Data Year Quarter Sales 77 2 88 3 92 4 80 2 1 78 2 90 3 94 4 78 3 109 2 128 3 130 4 118 4 103 2 136 3 141 123 1
Step by Step Solution
There are 3 Steps involved in it
1 Expert Approved Answer
Step: 1 Unlock

Question Has Been Solved by an Expert!
Get step-by-step solutions from verified subject matter experts
Step: 2 Unlock
Step: 3 Unlock