

Question: The data in the following table are particulate emissions for 65 vehicles, in units of grams of particles per gallon of fuel. Construct a frequency

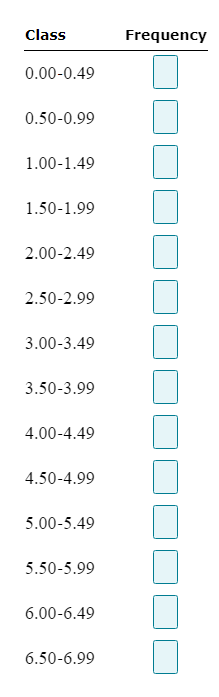
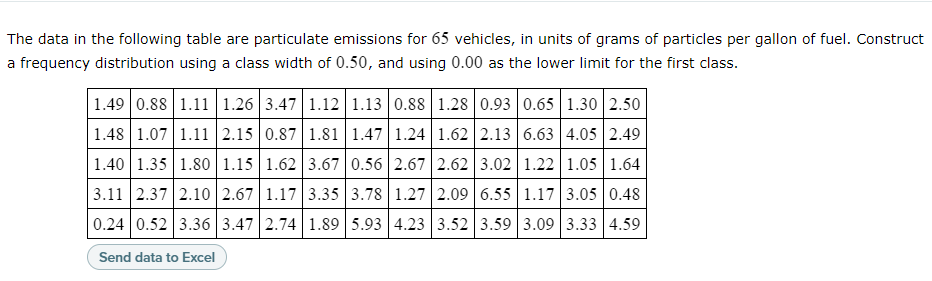

The data in the following table are particulate emissions for 65 vehicles, in units of grams of particles per gallon of fuel. Construct a frequency distribution using a class width of 0.50, and using 0.00 as the lower limit for the rst class. 1.49 0.88 1.11 1.26 1.12 1.13 0.88 1.28 0.93 0.65 1.30 2.50 1.48 1.07 1.11 2.15 1.81 1.47 1.24 1.62 2.13 6.63 4.05 2.49 1.40 1.35 1.80 1.15 3.67 0.56 2.67 2.62 3.02 1.22 1.05 1.64 3.11 2.37 2.10 2.67 3.35 3.78 1.27 2.09 6.55 1.17 3.05 0.48 0.24 0.52 3.36 3.47 2.74 1.89 5.93 4.23 3.52 3.59 3.09 3.33 4.59 I: Send data to Excel in
Step by Step Solution
There are 3 Steps involved in it
1 Expert Approved Answer
Step: 1 Unlock

Question Has Been Solved by an Expert!
Get step-by-step solutions from verified subject matter experts
Step: 2 Unlock
Step: 3 Unlock