

Question: The data in the table below come from the comparison of the growth rates for bacteria types A and B. The growth y recorded
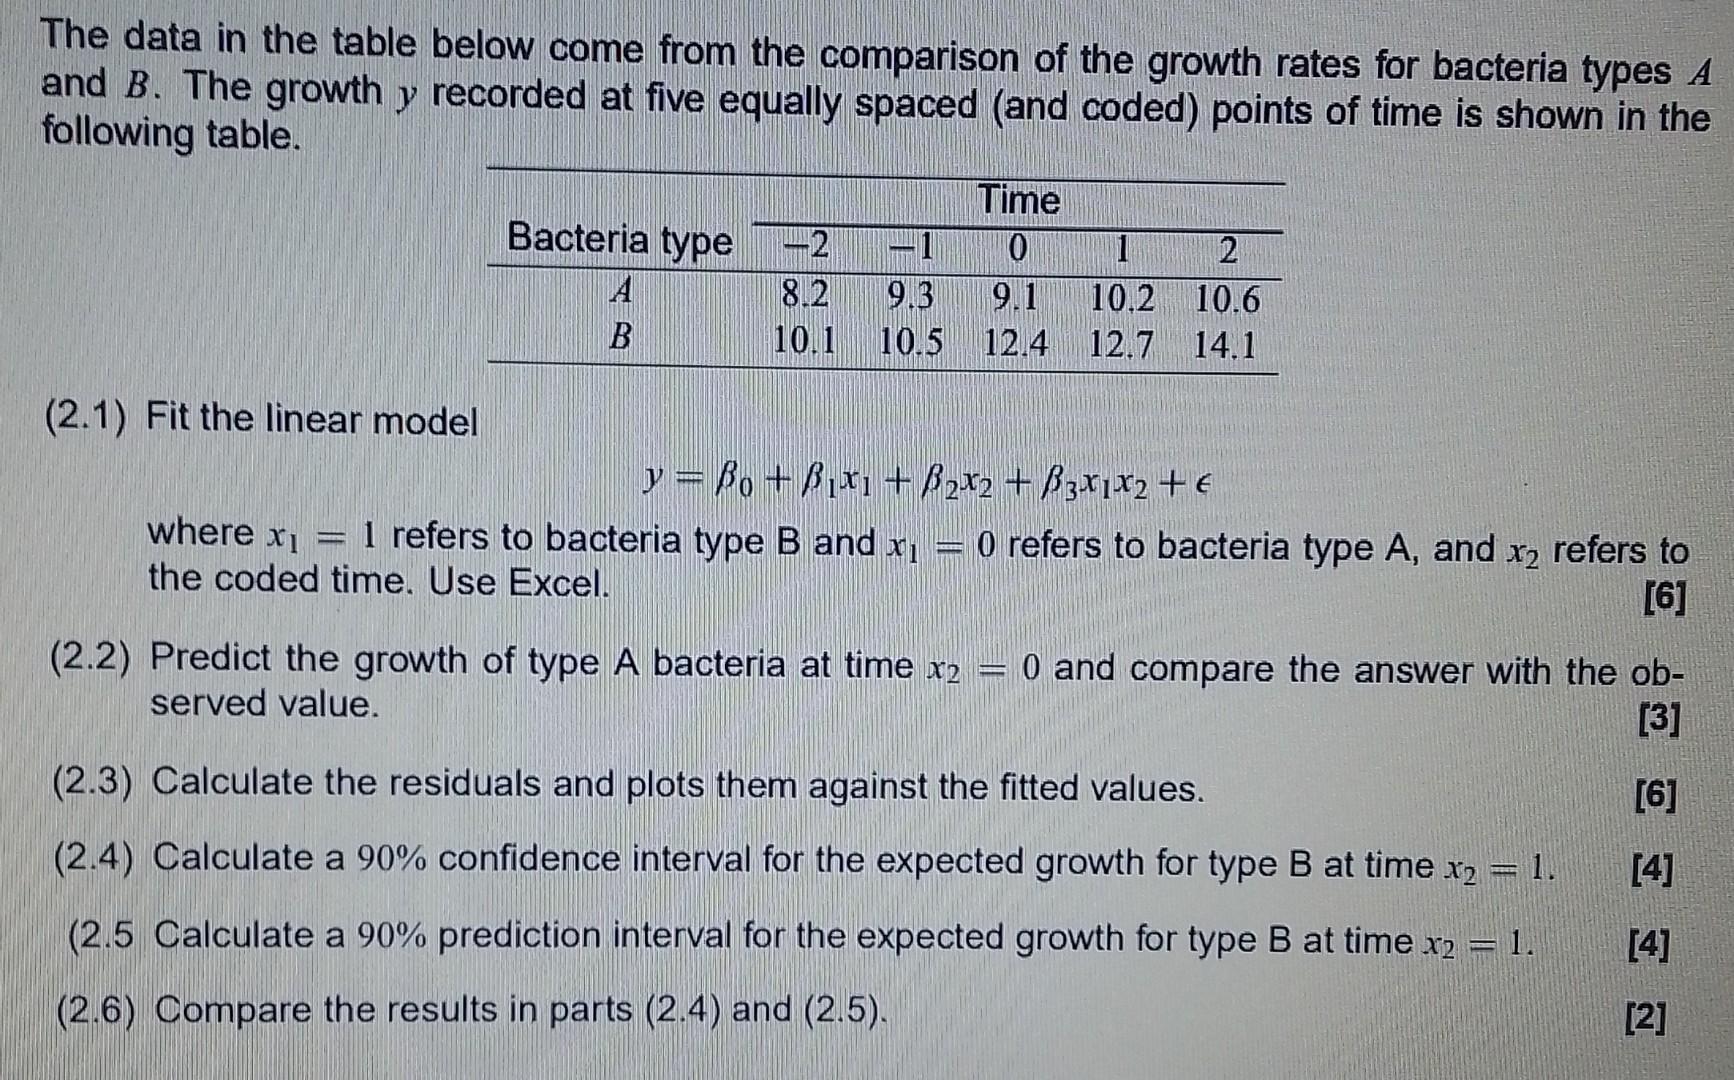
The data in the table below come from the comparison of the growth rates for bacteria types A and B. The growth y recorded at five equally spaced (and coded) points of time is shown in the following table. (2.1) Fit the linear model Bacteria type A B www -2 1 2 8.2 9.3 9.1 10.2 10.6 10.1 10.5 12.4 12.7 14.1 1 Time 0 y = Bo + Bx + BX + B3X1X + where xi 1 refers to bacteria type B and x 0 refers to bacteria type A, and x refers to the coded time. Use Excel. [6] (2.2) Predict the growth of type A bacteria at time x2 served value. p 0 and compare the answer with the ob- [3] [6] [4] [4] [2] (2.3) Calculate the residuals and plots them against the fitted values. (2.4) Calculate a 90% confidence interval for the expected growth for type B at time x = 1. (2.5 Calculate a 90% prediction interval for the expected growth for type B at time x2 = 1. (2.6) Compare the results in parts (2.4) and (2.5).
Step by Step Solution
3.53 Rating (156 Votes )
There are 3 Steps involved in it

Get step-by-step solutions from verified subject matter experts