

Question: The data in the table below shows how the activity of a sample of radium-222 changes with time. Plot a graph of activity against
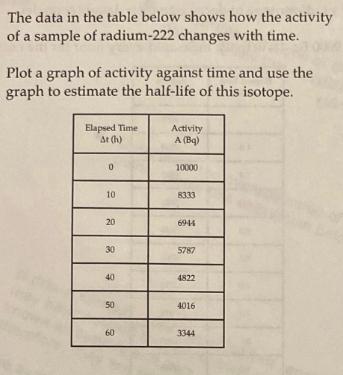
The data in the table below shows how the activity of a sample of radium-222 changes with time. Plot a graph of activity against time and use the graph to estimate the half-life of this isotope. Elapsed Time At (h) 0 10 20 30 40 50 60 Activity A (Bq) 10000 8333 6944 5787 4822 4016 3344
Step by Step Solution
There are 3 Steps involved in it
1 Expert Approved Answer
Step: 1 Unlock

Question Has Been Solved by an Expert!
Get step-by-step solutions from verified subject matter experts
Step: 2 Unlock
Step: 3 Unlock