

Question: The data in the table below were taken by one operator during a gauge capability study. ( a ) Estimate sigma - gauge. ( b
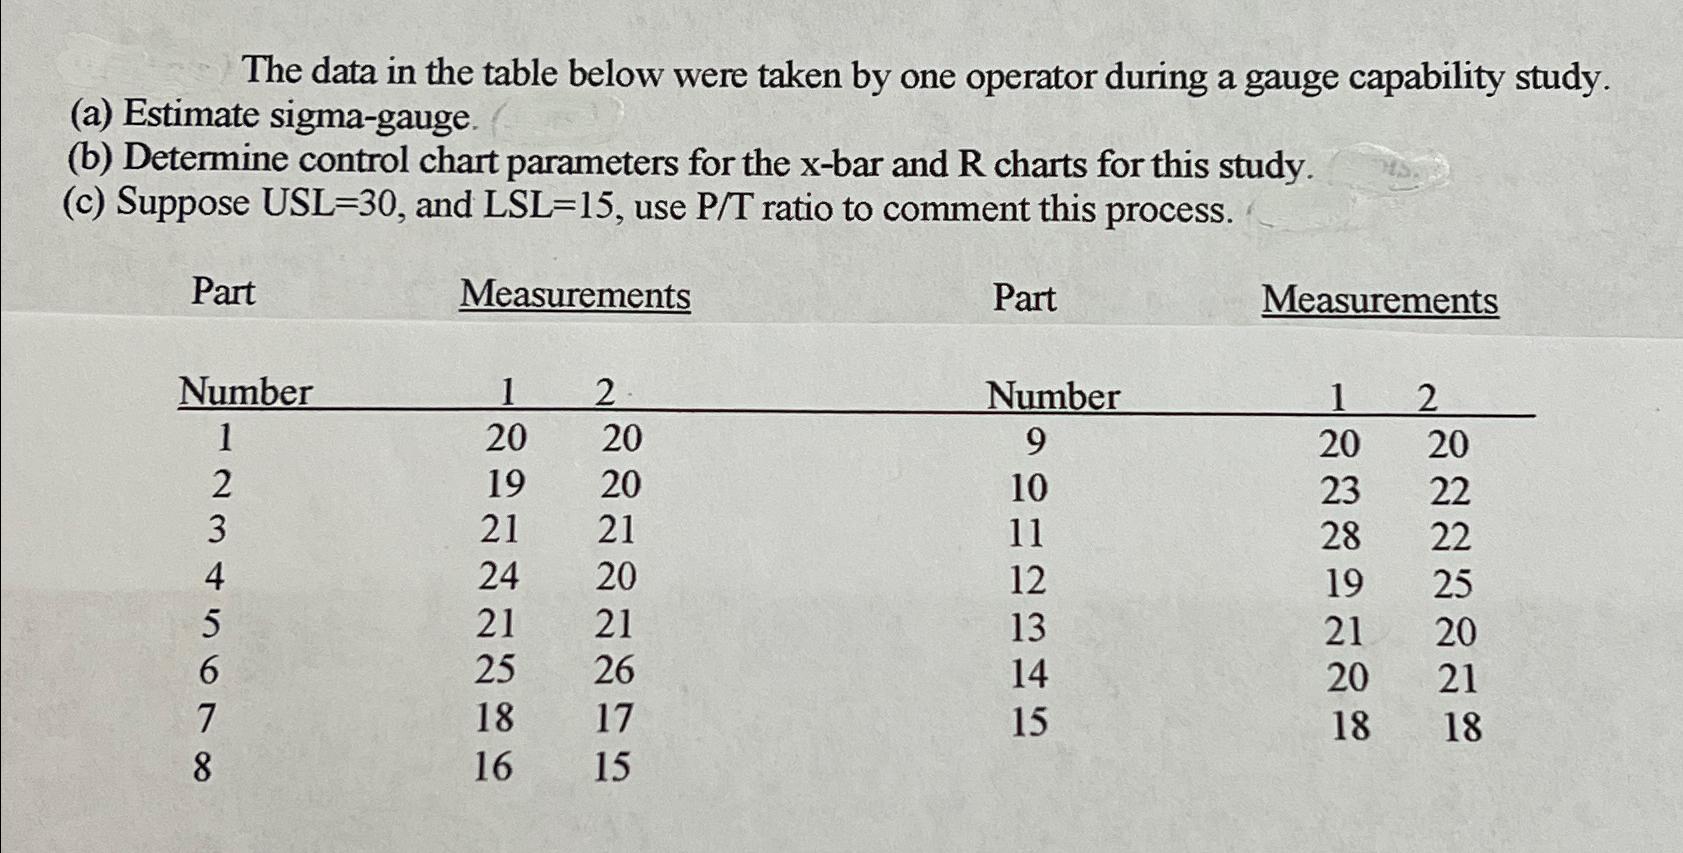
The data in the table below were taken by one operator during a gauge capability study.
a Estimate sigmagauge.
b Determine control chart parameters for the bar and charts for this study.
c Suppose USL and use ratio to comment this process.
tablePartMeasurements,Part,MeasurementsNumberNumber,
Step by Step Solution
There are 3 Steps involved in it
1 Expert Approved Answer
Step: 1 Unlock

Question Has Been Solved by an Expert!
Get step-by-step solutions from verified subject matter experts
Step: 2 Unlock
Step: 3 Unlock