

Question: The data is below please show code to plot on matlab!! 3) (10 pts) Spectrum of scattering coefficient Download 'mus.txt' from the course website. This
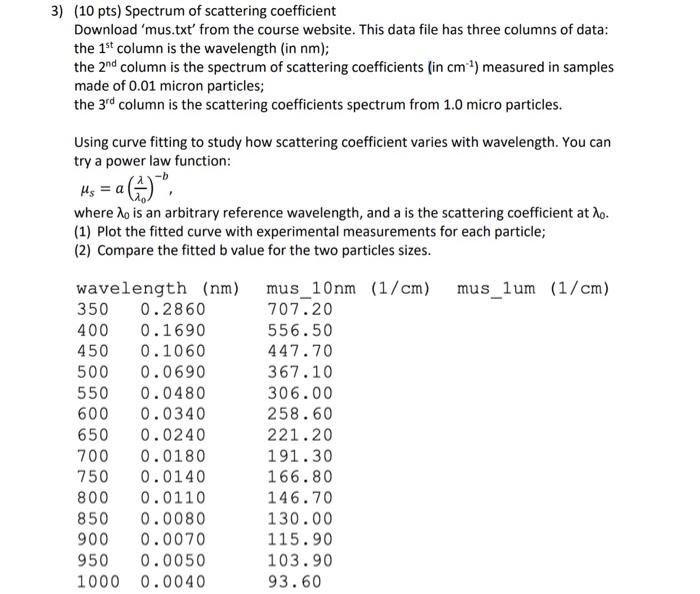
3) (10 pts) Spectrum of scattering coefficient Download 'mus.txt' from the course website. This data file has three columns of data: the 1st column is the wavelength (in nm ); the 2nd column is the spectrum of scattering coefficients (in cm1 ) measured in samples made of 0.01 micron particles; the 3rd column is the scattering coefficients spectrum from 1.0 micro particles. Using curve fitting to study how scattering coefficient varies with wavelength. You can try a power law function: s=a(0)b, where 0 is an arbitrary reference wavelength, and a is the scattering coefficient at 0. (1) Plot the fitted curve with experimental measurements for each particle; (2) Compare the fitted b value for the two particles sizes
Step by Step Solution
There are 3 Steps involved in it

Get step-by-step solutions from verified subject matter experts