

Question: The data set below represents the amount of time (in minutes) a group of students spend on social media based on gender. Use the given
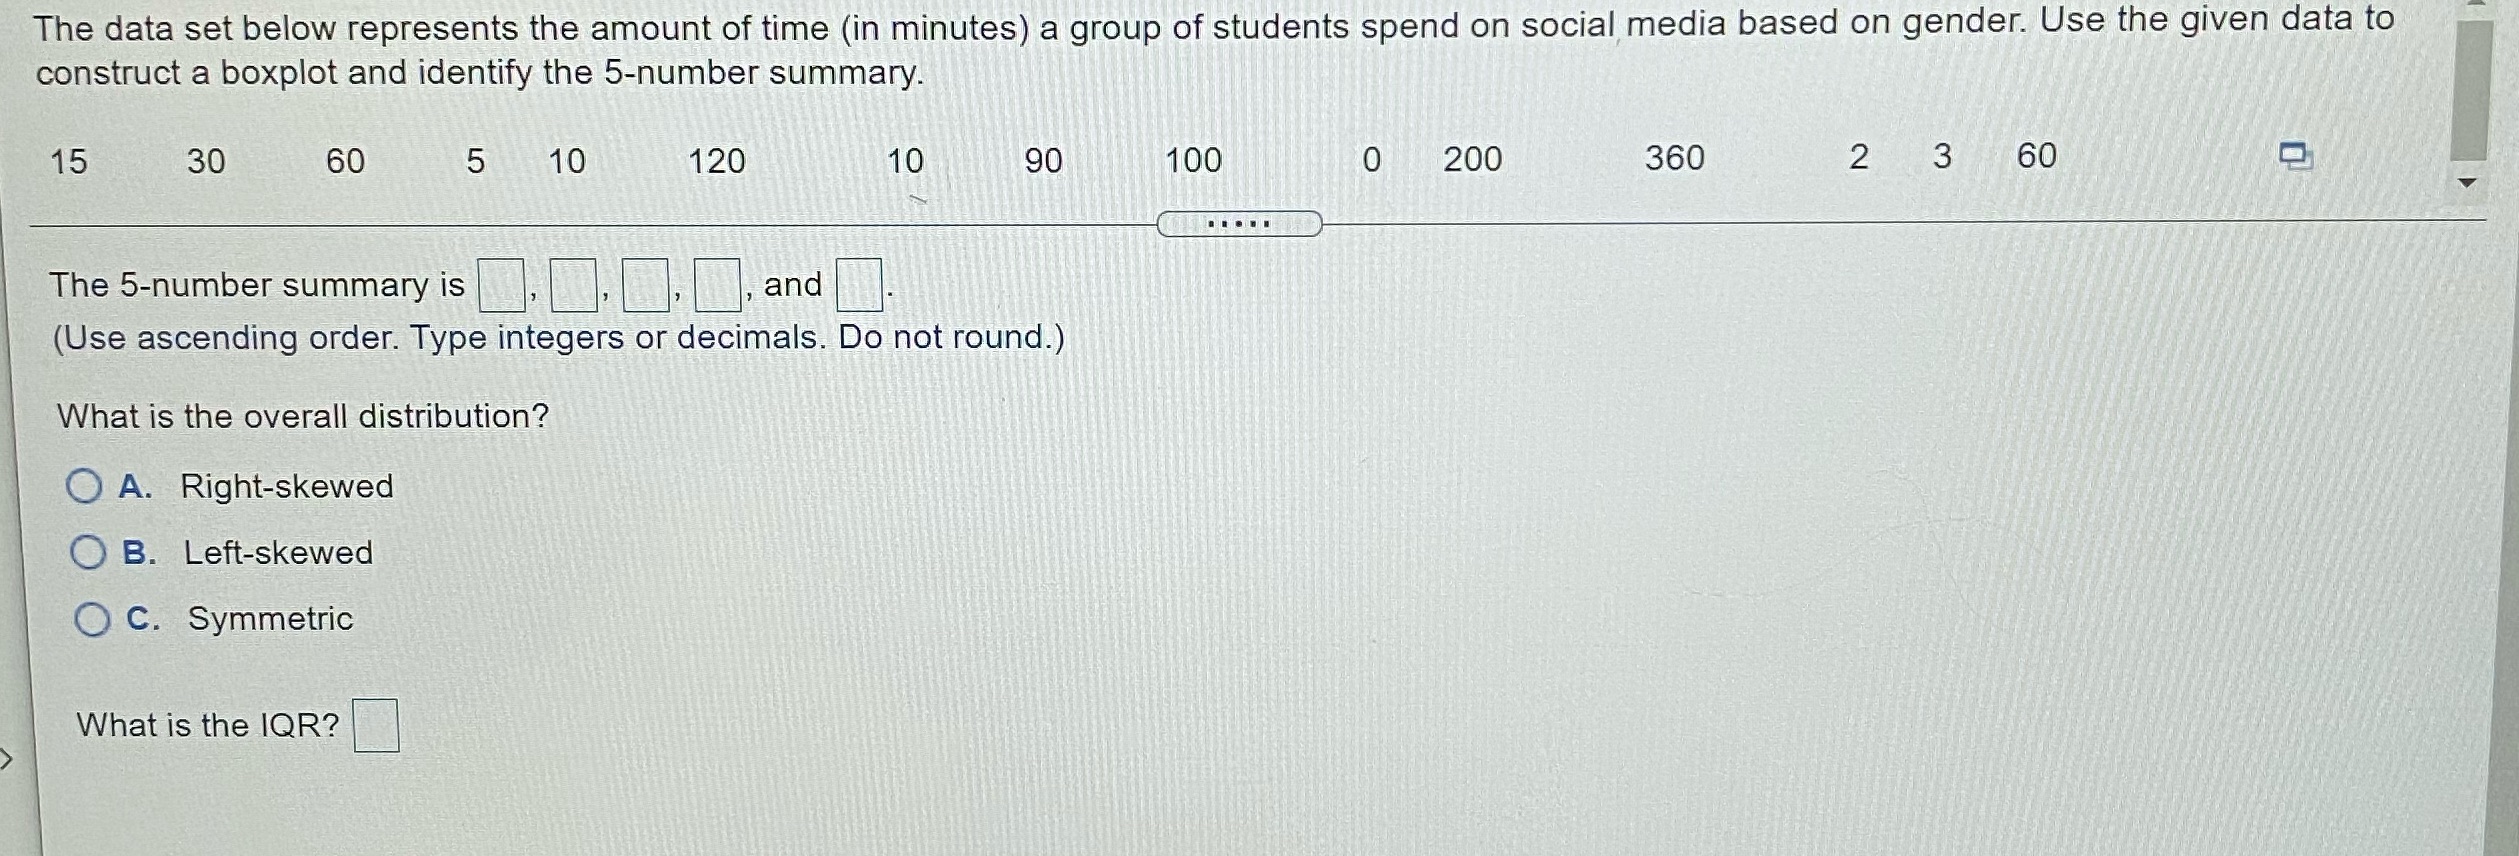
The data set below represents the amount of time (in minutes) a group of students spend on social media based on gender. Use the given data to construct a boxplot and identify the 5-number summary. 15 30 60 5 10 120 10 90 100 0 200 360 2 3 60 The 5-number summary is and (Use ascending order. Type integers or decimals. Do not round.) What is the overall distribution? O A. Right-skewed O B. Left-skewed O C. Symmetric What is the IQR
Step by Step Solution
There are 3 Steps involved in it
1 Expert Approved Answer
Step: 1 Unlock

Question Has Been Solved by an Expert!
Get step-by-step solutions from verified subject matter experts
Step: 2 Unlock
Step: 3 Unlock