

Question: the data set is too big , how do I upload it? screenshot is hazy | posted website-traffic.csv and room-temperature.csv datasets in teams. 1. Load
the data set is too big , how do I upload it? screenshot is hazy
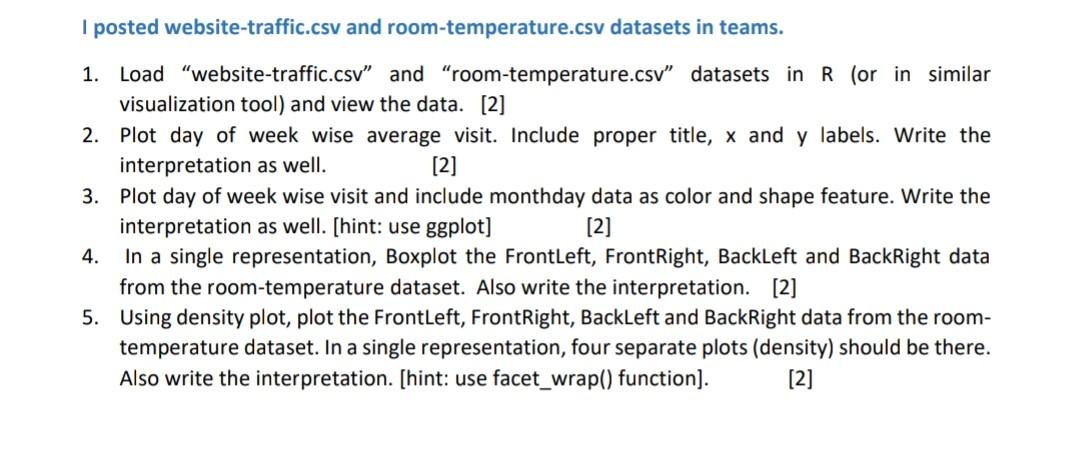
| posted website-traffic.csv and room-temperature.csv datasets in teams. 1. Load "website-traffic.csv" and "room-temperature.csv" datasets in R (or in similar visualization tool) and view the data. [2] 2. Plot day of week wise average visit. Include proper title, x and y labels. Write the interpretation as well. [2] 3. Plot day of week wise visit and include monthday data as color and shape feature. Write the interpretation as well. [hint: use ggplot] [2] 4. In a single representation, Boxplot the FrontLeft, FrontRight, BackLeft and BackRight data from the room-temperature dataset. Also write the interpretation. [2] 5. Using density plot, plot the FrontLeft, FrontRight, BackLeft and BackRight data from the room- temperature dataset. In a single representation, four separate plots (density) should be there. Also write the interpretation. [hint: use facet_wrap() function). [2]
Step by Step Solution
There are 3 Steps involved in it

Get step-by-step solutions from verified subject matter experts